
 Bitcoin
 Ondo
Ondo Pudgy Penguins
 Walrus
 Pons
Pons Quantus
 NEAR Protocol
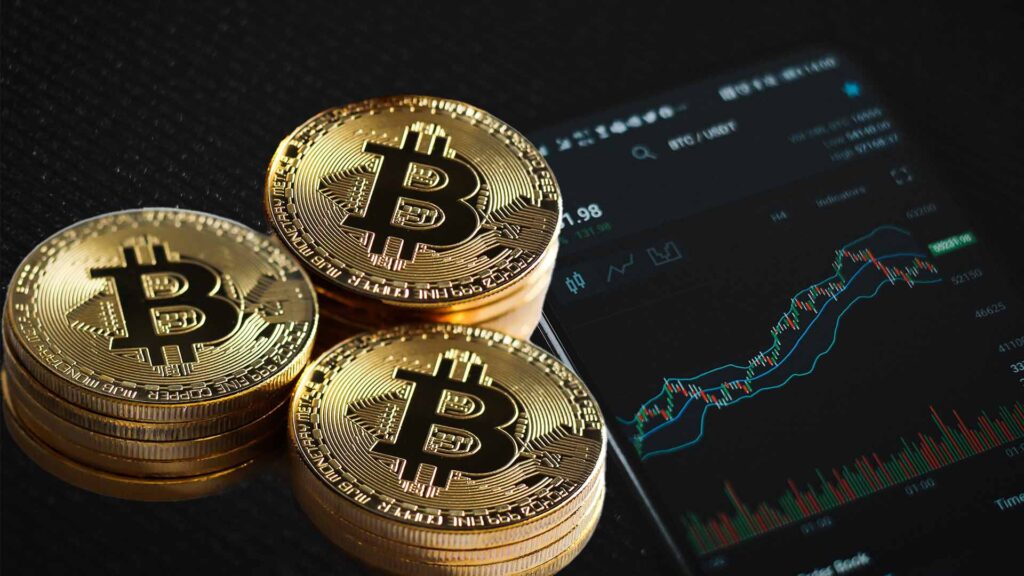
Bitcoin price traded near $64,000 as analysts assessed a rare relative-value signal against gold. The BTC-gold oscillator fell to its deepest reading in the available historical data, showing Bitcoin far below its longer-term relative trend.
At the same time, traders continued watching an untested support area near $61,000. Gold held above a short-term support zone on the cited chart, leaving both assets at important technical levels.
Bitcoin Price Watches $61K Support
Bitcoin price is trading near $64,000 after recovering from recent weakness, but the short-term chart still leaves one major level unresolved. Crypto Tony said $61,000 is a key support level that has not yet been tested.
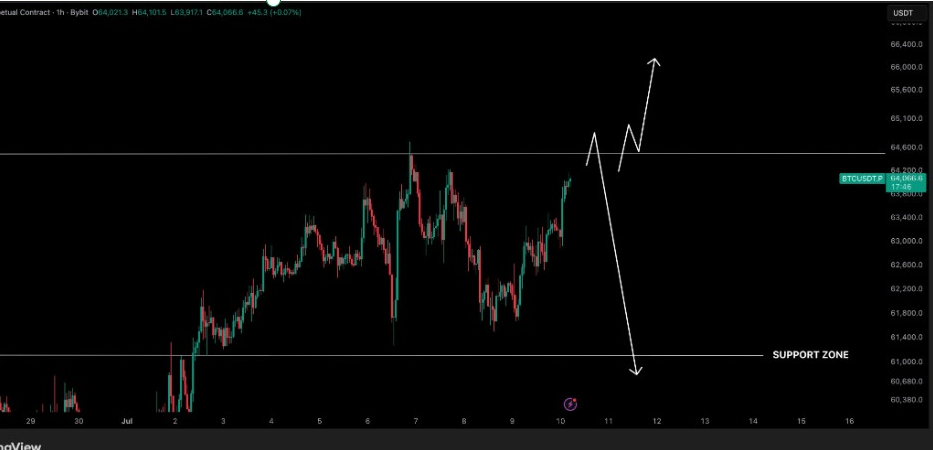
His chart shows Bitcoin moving inside a tight intraday range, with price sitting below nearby resistance and above the support zone. The setup gives traders two possible paths. BTC can either push higher from current levels or sweep lower toward $61,000 before attempting another rebound.
The $61,000 region matters because it lies near the lower end of the recent consolidation structure. A clean hold there would help bulls defend the broader recovery attempt. A break below it may bring fresh pressure and open the door toward lower liquidity zones.
For now, Bitcoin needs to reclaim the $64,600 area first. A stronger move above that level would shift focus toward $67,300, while a failed reclaim could keep the $61,000 retest in play.
BTC-Gold Signal Hits Record Oversold Zone
Meanwhile, Bitcoin has reached its most oversold level against gold in recorded history. The shared oscillator compares Bitcoin’s performance against gold and places the current reading below both the short-term and four-year average bands.
The chart showed today’s BTC-gold reading near -1.81, while the four-year average sits around -1.42. The analyst also noted that the monthly chart has fallen to its second-most oversold reading in history.
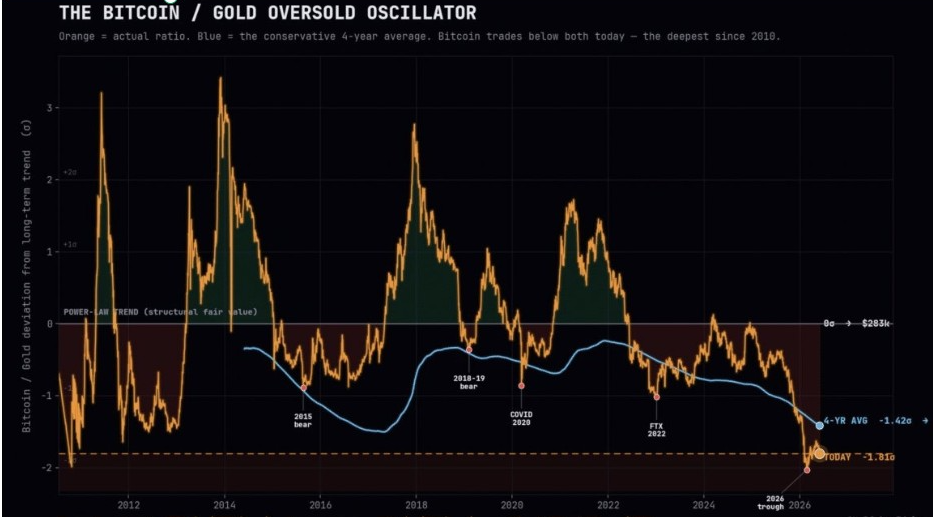
Historically, deep oversold readings against gold have appeared near major cycle stress points. The chart highlights previous periods around the 2015 bear market, the 2018–2019 bear market, the 2020 COVID crash, and the 2022 FTX collapse.
According to Coin Bureau, the last time this indicator flashed, Bitcoin later rallied nearly 660% over the following years. That does not confirm an immediate rebound, but it shows how stretched the BTC-gold relationship has become.
Gold Holds Above Short-Term Buy Zone
Notably, Ollie Analyst said gold is trading near $4,114 after recovering from lower structure around $4,022. His chart showed gold holding above the $4,100–$4,107 liquidity zone while forming a short-term change of character and break of structure.
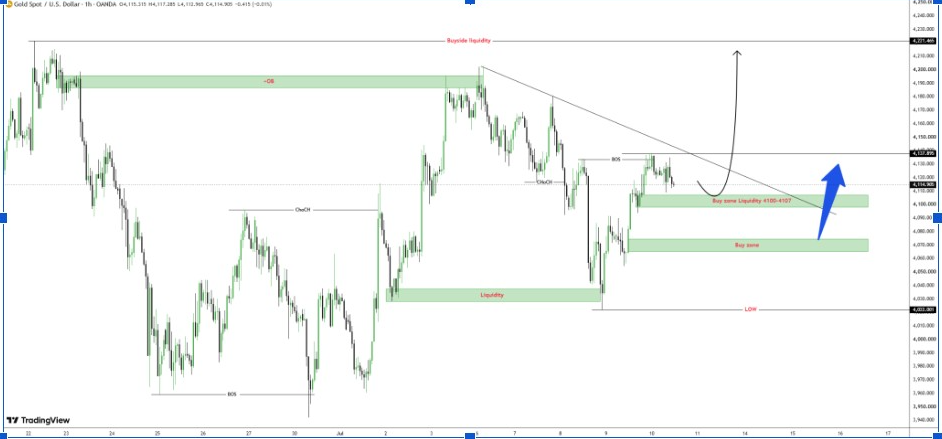
The analyst said gold could push toward $4,137 if buyers continue defending that liquidity area. A clean break above the descending trendline would strengthen the bullish setup and bring the upper order-block zone near $4,221 back into view.
The downside levels are also clear. If gold fails to protect the current buy zone, Ollie Analyst expects a secondary liquidity sweep toward $4,065–$4,075.
That keeps gold constructive, but not without risk. The metal is still trading below higher resistance, while buyers need another confirmation above $4,137 before momentum improves.
BTC-Gold Correlation Shows Two Different Trades
Additionally, Stacy Muur argued that Bitcoin and gold may share the same “digital gold” narrative, but they do not trade as identical assets. Her chart tracks Bitcoin price, gold price, and the BTC-gold correlation.
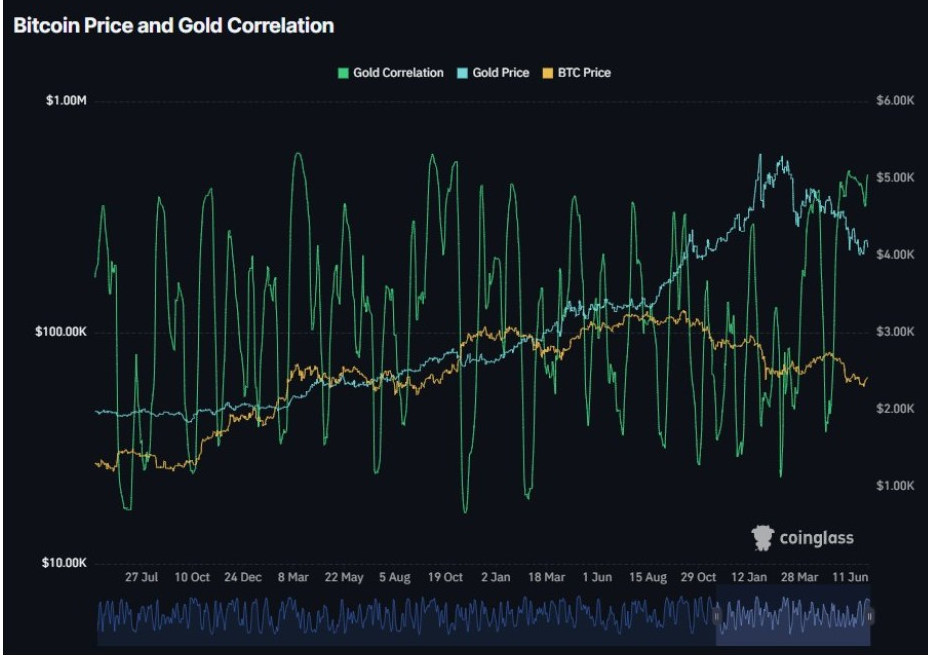
She noted that the correlation line keeps jumping instead of holding steady. That means Bitcoin and gold sometimes move together, but they also diverge during stress periods and liquidity shifts.
This distinction matters for portfolio behavior. Gold has recently held near elevated levels, while Bitcoin has become deeply oversold against it. That gap suggests BTC may be lagging gold rather than mirroring it. If Bitcoin holds $61,000 and reclaims $64,600, traders may start looking for a catch-up move.


