Wisp
Wisp Doge Pepe
 Zylo Ecosystem
 Crawlerpad
 Pudgy Penguins
 Pearl
Pearl Basic Attention
Solana price is sitting at a key decision zone after a fast rally that lost momentum near $84. The latest charts show SOL crypto trading around $75, where buyers now need to defend support to keep the recovery structure alive.
The next few sessions could decide whether Solana price resumes its push toward $90 or slides back toward the $70 range. Traders are watching short-term structure, rising-channel setups, and broader weekly patterns for confirmation.
Solana Price Holds a Critical $75 Zone
Solana price is trading near $75 after a sharp vertical move from about $67 to $84. The rally showed strong demand at first, but the follow-up structure has weakened, with lower highs and lower lows forming on the short-term chart.
Independent market analyst Jack (@XHandle) noted that SOL was sitting at an important decision area, according to a chart published on X. His chart shows the first major pullback after the strong upward move, which often tests whether buyers still control the trend. If SOL crypto holds $75, the token could attempt a relief bounce and rebuild short-term momentum.
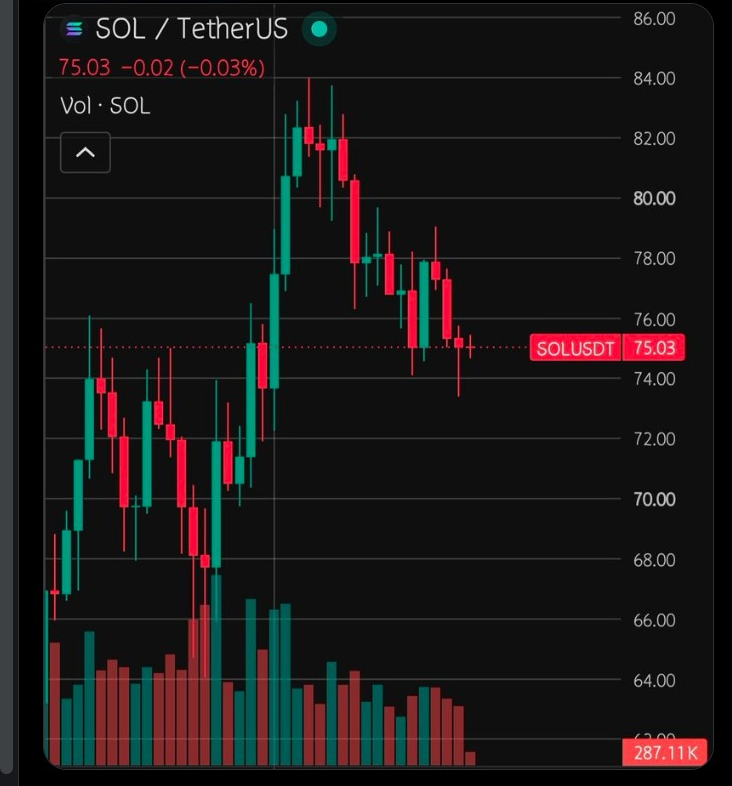
However, a clean loss of $75 would change the immediate setup. In that case, the next support area comes into focus between $72 and $70. That range matters because it sits below the current consolidation and could act as the next demand zone if sellers extend pressure.
The key bullish trigger is a reclaim of $78. A move above that level would show that buyers are absorbing the pullback and pushing SOL back into a stronger structure. Without that reclaim, the market may remain stuck between support defense and short-term selling pressure.
SOL Crypto Short-Term Downtrend Still Needs a Break
Technical analyst BitGuru (@BitGuru) shared a chart on X showing SOL trading within a short-term downtrend. The price has moved lower from the early July highs, and the market is now following a descending structure.
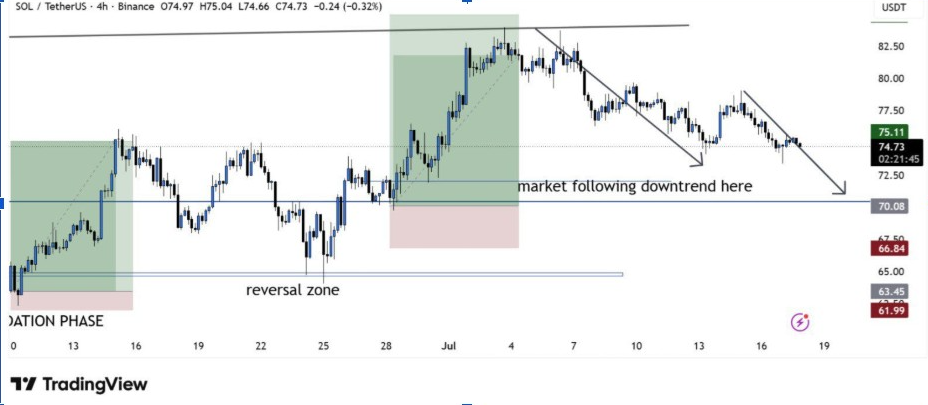
This setup does not erase the previous rally, but it does show that buyers have not fully regained control. SOL crypto needs to break the short-term downward path before the next bullish phase can gain strength. If selling continues, BitGuru places the next key support near $70.
That $70 level now acts as a downside checkpoint. A pullback into that area would not automatically destroy the broader recovery, but it would weaken the current momentum. A strong reaction from $70 could still preserve a higher-low structure.
At the same time, failure to defend $70 would raise the risk of a deeper retracement. That would shift attention back to lower support zones and delay any clean continuation attempt. For now, SOL crypto ability to hold above $75 remains the first signal to watch.
SOL Price Rising Channel Keeps $90 in View
Market commentator Satoshi Flipper (@SatoshiFlipper) shared an 8-hour chart on X showing SOL trading inside a rising channel. The setup places SOL crypto inside a rising channel, with price currently near the lower boundary of that structure.
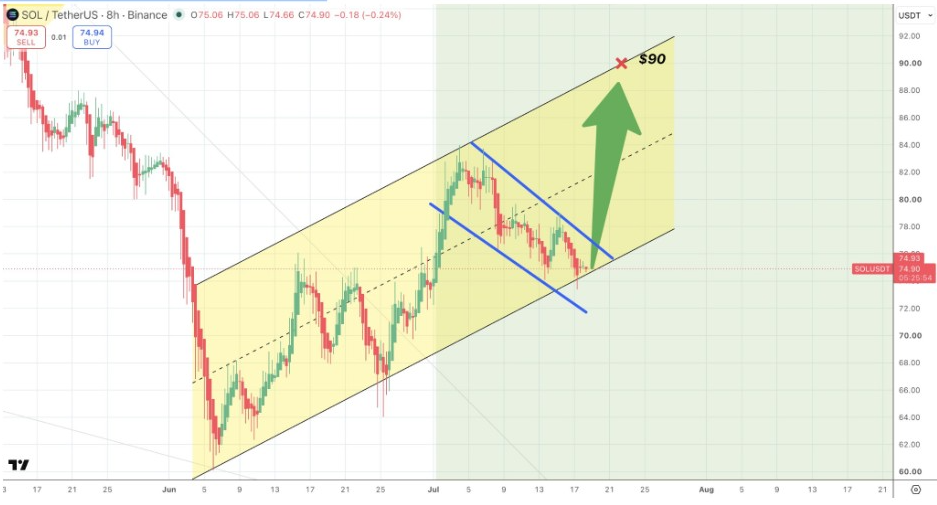
The chart marked $90 as the next major upside zone if Solana holds the channel and rebounds from current levels. This means the $75 region is not only short-term support but also a potential launch area inside the broader upward channel.
A move from $75 toward $90 would require SOL to first reclaim nearby resistance levels. The first important area remains around $78, followed by the upper range that formed after the recent rally. If momentum expands from there, the $90 target becomes more realistic.
Still, the channel setup depends on continued respect of the lower trendline. If SOL crypto breaks below the channel and loses $75, the bullish path toward $90 would weaken. That makes the current level one of the most important areas on the chart.
Solana Price Bigger Chart Points to Higher Targets
Additionally, James Easton’s weekly chart suggests Solana may still be forming a larger recovery structure. His view showed SOL price trading inside a broad descending channel after its earlier cycle peak, while the price sits near the lower side of that long-term range.
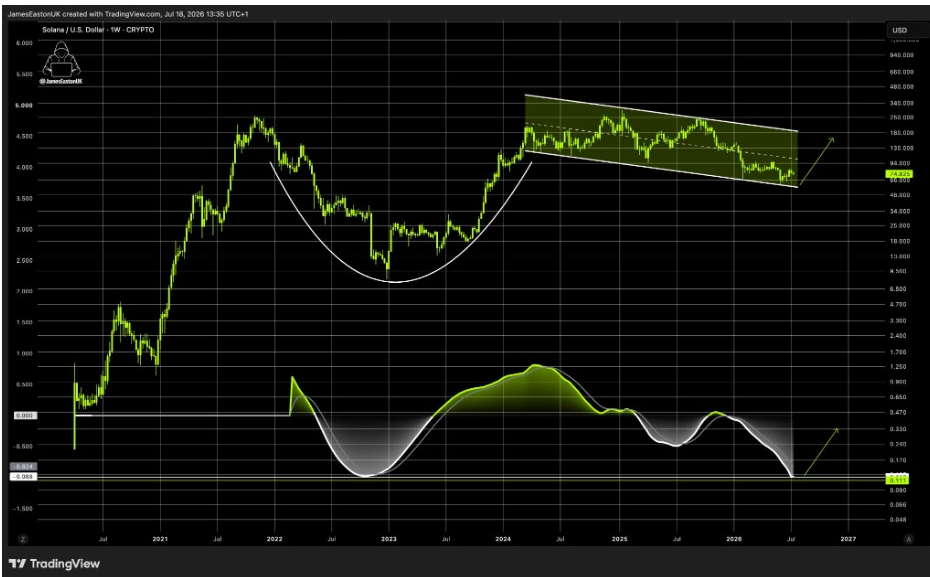
He argued that SOL is moving under the radar and could eventually reclaim $100 before aiming at larger targets. The chart also shows a rounded base structure before the current compression, suggesting that a longer-term bottoming process may be forming.
This technical analysis is for informational purposes only and should not be considered financial or investment advice. Cryptocurrency markets are highly volatile, and the price levels discussed are based on analysts’ chart interpretations rather than guaranteed outcomes. Readers should conduct their own research before making investment decisions.
However, the target remains speculative until SOL crypto confirms strength on lower timeframes. The first step is still holding $75, reclaiming $78, and then breaking toward the $90 region. A move above $90 would place the psychological $100 level back in focus.