Pearl
Pearl Zylo Ecosystem
 Sui
Sui Starknet
 Pons
Pons NEAR Protocol
 Quantus

Ethereum price extended its recovery toward $2,500 after gaining roughly 30% over the past week. ETH climbed from around $1,914 on Aug. 17 to approximately $2,499 on Aug. 24 as crypto-market sentiment improved.
The rally coincided with Ethereum’s strongest ETF inflows of 2026 and improving relative strength against Bitcoin. However, ETH remains close to important resistance, while short-term momentum indicators show the rally has become increasingly stretched.
Ethereum Price Prediction Puts $2,700 in Focus
Ethereum price traded above $2,500 after gaining about 30% over the past week. The advance placed ETH close to the $2,600 resistance level, which now stands between the current price and higher targets. A move above that level could bring $2,550 and $2,600 into focus before $2,700. Sustained volume could confirm strength above resistance.
Momentum data still shows strong demand, although short-term conditions have become tighter. The four-hour RSI stood near 66.74, while the latest chart showed a bearish MACD crossover. Those readings place more attention on price confirmation around $2,500 rather than momentum alone.
If sellers reject ETH crypto near $2,600, the first support area sits around $2,350. A deeper pullback would place $2,300 under pressure, followed by $2,200. The $2,300 to $2,500 range therefore defines the main short-term zone for the next directional move.
ETH/BTC Breakout Changes the Relative-Strength Structure
The ETH/BTC daily chart has moved above a multi-month descending structure. Crypto Patel marked 0.03205 as the breakout level after the pair printed a higher high. The chart also shows a break from the sequence of lower highs and lower lows that controlled the pair for months.
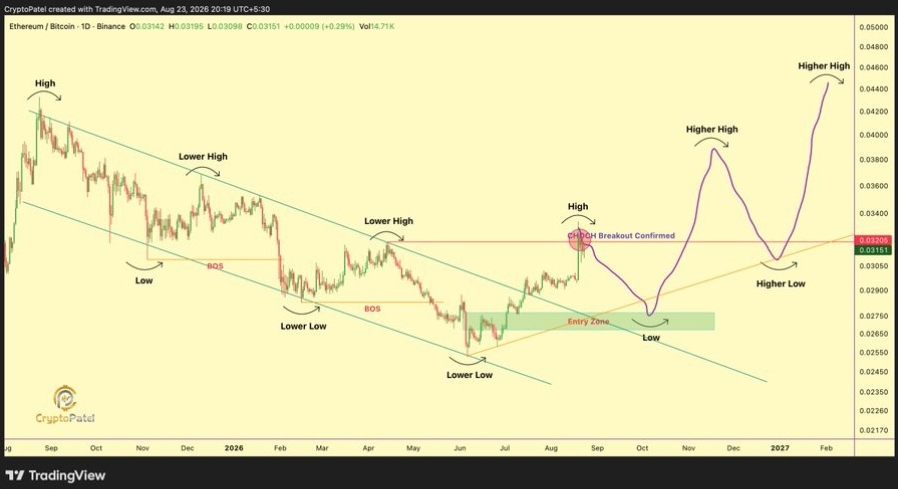
ETH/BTC traded near 0.03151 on the chart after reaching an intraday high around 0.03195. The next technical test sits below the breakout area. Crypto Patel identified 0.0270 to 0.0260 as the retest zone, where the pair would need to form a higher low to preserve the new structure. That level also aligns with the rising trendline.
The chart maps higher relative-strength targets near 0.040 and 0.050 if the pair holds the retest zone. It also marks a broader 0.060 to 0.070 range for a larger extension. A move back below the new structure would weaken the breakout setup.
Ethereum ETF Inflows Add Institutional Support
Spot Ethereum ETFs recorded about $697 million in net inflows between August 17 and August 21. Bitcoin ETFs attracted about $1.918 billion during the same period. Ethereum funds therefore drew a smaller absolute amount but a larger share relative to Ethereum’s market capitalization.
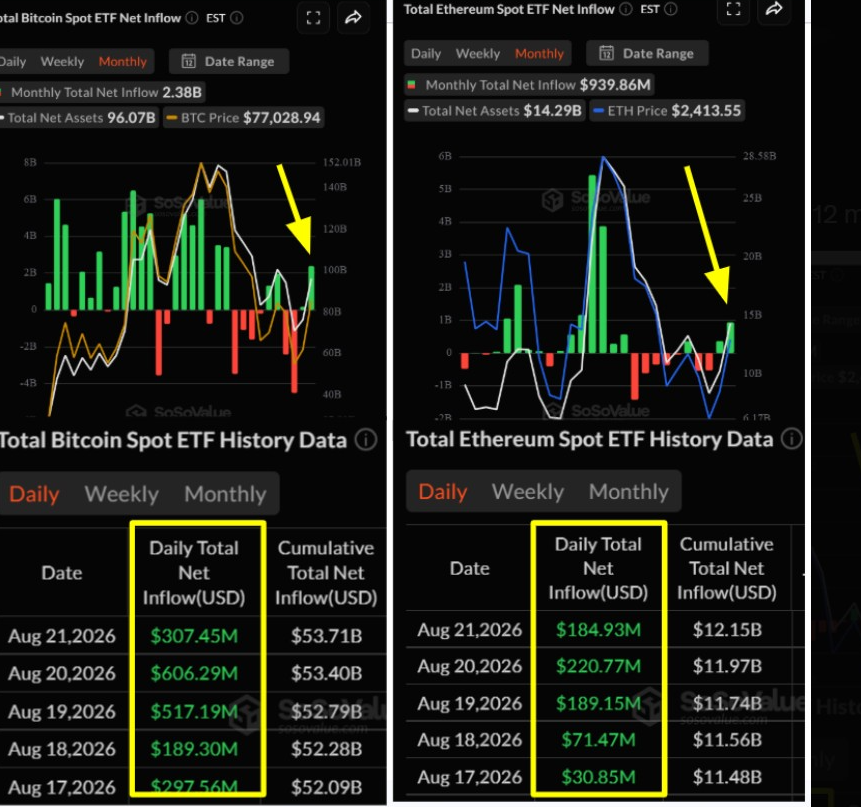
Jiang Zhuoer noted that Ethereum’s market value stood near 18.8% of Bitcoin’s, while ETH ETF inflows reached about 36.4% of Bitcoin ETF inflows. The comparison points to stronger inflow intensity relative to market size during the week.
The inflows arrived while Ethereum outperformed Bitcoin on a percentage basis. Bitcoin traded near $77,000 during the period, while total crypto market capitalization rose to about $2.61 trillion. The combination of ETF demand and stronger ETH/BTC performance kept Ethereum at the center of the latest market rotation.
Ethereum Price Holds Support After Sharp Weekly Gain
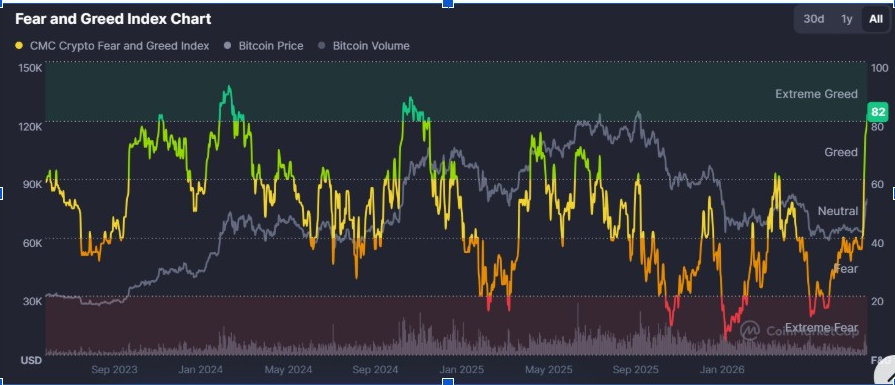
Market sentiment has also moved into extreme greed. For the first time since December 2024, the Crypto Fear and Greed Index reached 81. That reading followed rapid gains across several large-cap assets, including Ethereum and XRP.
Ethereum price now needs support to hold after the sharp weekly advance. Buyers have defended the $2,350 to $2,300 area so far, while $2,500 remains the main resistance. A confirmed break above $2,500 would keep $2,700 in view, while a break below $2,300 would shift attention toward $2,200.
The ETH/BTC chart adds another level to monitor. Holding 0.0270 to 0.0260 on a retest would preserve the higher-low structure shown in the chart.