Universal High Income
 OnlyAgent
 Pudgy Penguins
 Aerodrome Finance
 NEAR Protocol
 Internet Computer
 Sui

- Swipe token has been performing under selling pressure for more than nine months.
- The price action of the SXP token is near to breaking the descending triangle pattern.
- SXP/BTC pair price is favorable by 3.75% at 0.00004181 BTC.
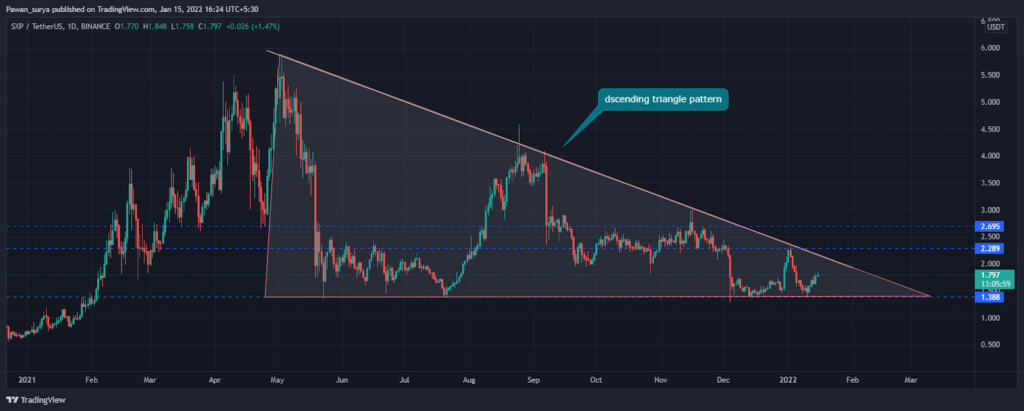
After crossing $1.38 at the starting February, the SXP token reached an all-time excessive stage of $5.86, with a marvelous bull run. Then the investor booked their outperforming profit, and bears got here into existence; the result is token dumped down, and merchants grew to become the witness of the bloodbath.
The live data of Swipe Token price is positive by 6.44% at $1.80. Over the past 24-hours, trading volume has been slightly up by 2.11% at $202 million, indicating traders are not interested in the token. SXP/BTC pair price is in the green zone by 3.75% at 0.00004181 BTC. Herewith, SXP/ETH pair price is up by 2.93% at 0.0005418 ETH. At the time of writing, the total value locked (TVL) of the SXP token is $2,562,543, and the market Cap/ TVL ratio is 136.63. SXP Token has 0.02% market dominance, and the Volume / Market Cap ratio is 0.5781.
As soon as SXP hit the ATH level ($5.86), then to till now it is exchanging in the descending triangle pattern. And recently, Token retested the bottom of this triangle which is $1.388. The triangle range is getting narrow Gradually, and it may move on from this pattern soon. The coin may break this range to the bullish side, but if it breaks down this triangle, it then reaches $0.578 critical level.
Can SXP Price Retest the $2.289 Key Level Again?
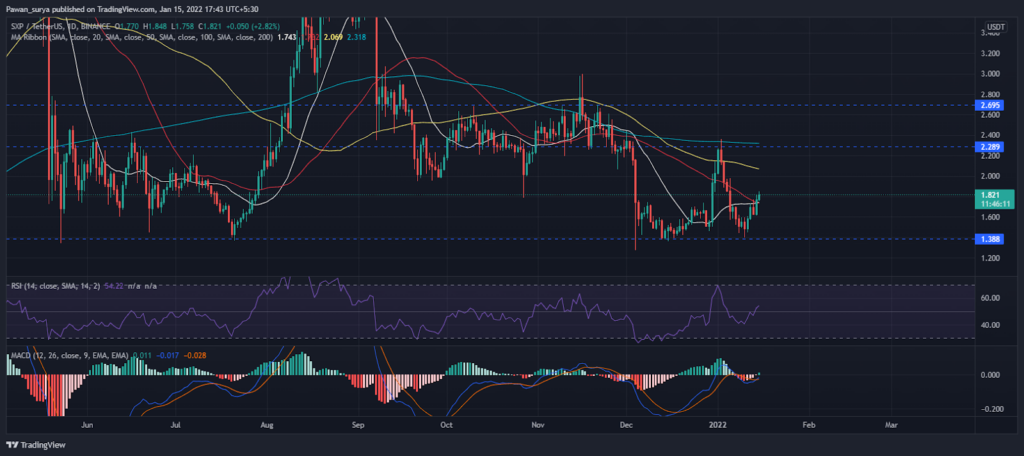
Recently, SXP price started moving above the 20, and 50 Moving Averages, which is showing a bit of buying is happening. 100 and 200 MAs will be the following bullish barriers for the further trading sessions.
RSI is now at 54 level, which seems bullish in the daily time frame. Although the MACD indicator generated a bullish crossover on 18 December, now MACD is near the neutral level and trying to breach the negative zone.
Conclusion
SXP Token probably will be bullish because it retested the triangle’s lower level and the indicators supporting the investors. If Token breaches the $2.289 fundamental level to the upside, then the $2.269 level will be the pivotal bullish barrier. On the other hand, if an asset hits the crucial support level ($1.388), then scary selling may occur.
Support level – $1.388
Resistance level – $2.28
Disclaimer
The views and opinions stated by the author, or any people named in this article, are for informational ideas only, and they do not establish financial, investment, or other advice. Investing in or trading crypto assets comes with a risk of financial loss.