
 Quack AI
 NEAR Protocol
 Lighter
 Bitway
 Pearl
Pearl Quantus
 Sui
Sui
- The Anchor Protocol token price has been continuously moving higher since the lowest level ever and regained around 330% increase in its value.
- The Anchor Protocol token price is trading above the vital moving averages 20,50,100 and 200 MAs, over the daily price chart.
- The ANC/BTC is favoring the bulls by 20.09% at 0.0001392 Satoshis.
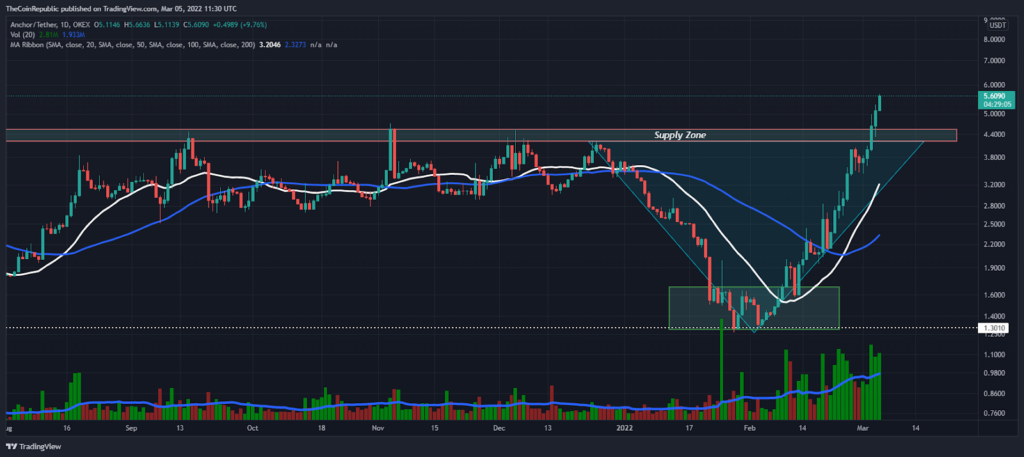
From late December to early February, the Anchor Protocol token cost had been underperforming. The ANC price has repeatedly tested the supply zone (noted in the graph). ANC investors acquired the token price in the horizontal box in early February (green). Over the last four weeks. Buyers have been rejoicing in the extreme bullish momentum (almost 330% increase).
Anchor Protocol price jumped above the supply area with excessive trading volume and the bulls are holding the daily price chart well above the key $5.0 support level. However, the coin saw a drop of 10.2% in the intraday trading session and is trading at $5.62. Meanwhile, the trading volume of the ANC token has increased by 58% over the past 24 hours. For the past several days, the daily trading volume bar has risen above the moving average (blue). Furthermore, the volume to market capitalization ratio is 0.295.
The Anchor Protocol token with respect to the Bitcoin Pair is trading in the green zone by 20.09% at 0.0001392 Satoshis and the ANC/ETH combination price is at 0.002157 ETH. Nevertheless, the USDT pair has been moving higher above the significant moving avengers (such as 20,50,100 and 200 MAs) over the daily price chart.
What is the reason for the sharp recovery in ANC’s value?
The rally, according to Henrik Andersen, co-founder of Australia-based crypto-asset investment firm Apollo Capital, is probably a combination of ANCs providing high annual percentage yields (APYs) and talk of new tokens.
Bulls may hit the psychological round level of $10 in upcoming days
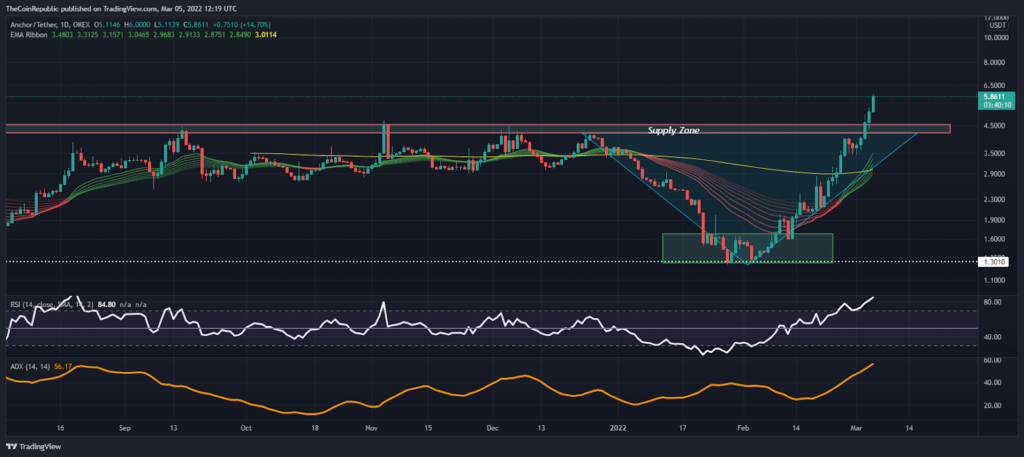
The EMA Ribbon indicator is supporting the bulls and it is moving lower from the current price of the Anchor Protocol token in context of the daily price chart. During the upcoming retracement phase, the ANC price may take support on 200-day moving (yellow).
The relative strength index has been continually moving higher after dipping into the oversold territory. At the time, the daily RSI is at 84-level (robust bullish). Furthermore, the average directional index is moving at 56-point, suggesting an extreme bullish momentum for the ANC token.
Conclusion
The Anchor Protocol token appears to be in extreme bullish territory and investors are celebrating the rapid recovery.
Resistance level- $7.0and $10
Support level- $1.30 and $1.0
Disclaimer
The views and opinions stated by the author, or any people named in this article, are for informational ideas only, and they do not establish the financial, investment, or other advice. Investing in or trading crypto assets comes with a risk of financial loss.




