
 Boomer
 Pearl
Pearl Covenant x402
 Claudia
 Bitcoin
 hi
hi NEAR Protocol
- Constellation Coin price broke out of a descending wedge pattern on 23 March and now appears to be slightly bullish.
- DAG token price is seen trading above the important moving average but it is yet to hit the 200-EMA.
- The DAG coin price belonging to the bitcoin pair is showing a gain of 7.4% at 0.000003991 satoshis.
The price of Constellation Coin saw an incredible rally in 2021, when the price of the coin increased by almost 5430% to an all-time high of $0.4621. Rapid directional momentum is followed by a retracement phase allowing for longer-term stability. Therefore, the DAG observed a descending wedge pattern (noted in the chart) and commented on a 24-February 2022 year low of $0.1100 during a downtrend.
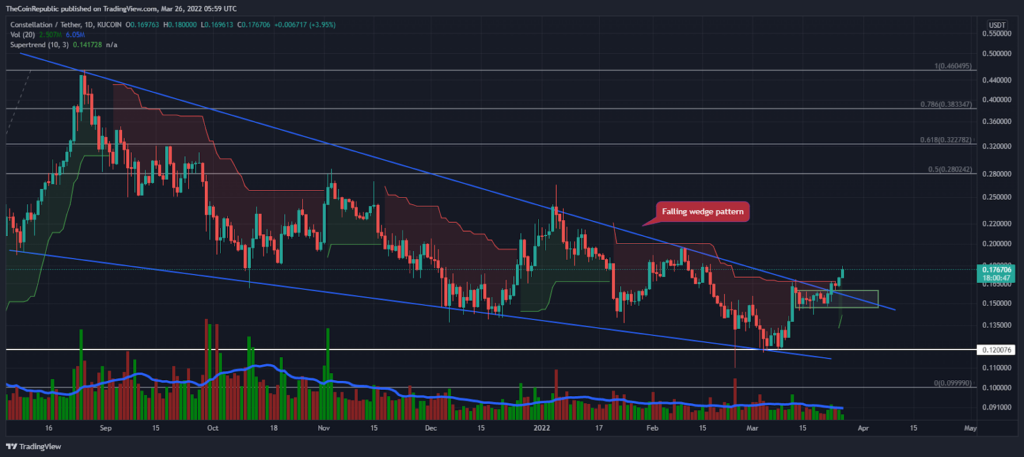
Since the 2022 minimum price, DAG bulls are often pushing the coin’s market cap higher; Therefore, the property has recovered almost 60% of the cost so far. However, the price of Constellation Coin suffered from sideways territory last week. At the time of writing, the price of the DAG token is trading at $0.177, an increase of 8.49%. Moreover, the DAG/BTC pair price is seeing a bullish trend similar to the USDT pair at 0.000003991 Satoshis.
Despite the bullish momentum, trading volume shows slightly lower liquidations for the DAG coin. Thus, the coin lost 9.3% of trading volume last night. Meanwhile, the volume to market capitalization ratio is 0.006684.
Technical indicators are in favor of the DAG bulls for short-term trend
For the upcoming trading session, the range of the consolidation phase (green box) may act as a demand zone and $0.28 represents a resistance level according to the 0.5-level of Fibonacci retracement.
The Super Trend indicator posted a bullish signal for the buyer last night, which could be the first of a trend reversal for the DAG coin price.
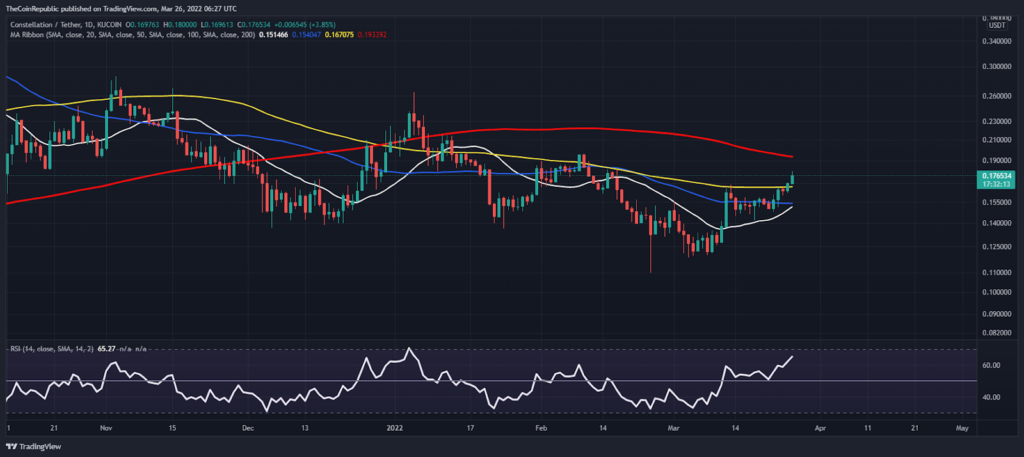
The Constellation Coin price is approaching the 200-day moving average (red), which is a zone of volatility. Other 20,50 and 100 EMAs are remaining below the current price of DAG coin in terms of the daily price chart.
Recently, the Relative Strength Index (RSI) took support at the half-line (50-point) before moving higher. Now the RSI is at 65-level and is going to move into an overbought area on the daily price graph.
Conclusion
Technical Indicators Constellation Coin is spotting a bullish trend after breaking the boundaries of a falling wedge pattern. RSI may complete its journey to overbought zone before any trend reversal sign
Support level – $0.1200 and $0.100
Resistance level – $0.200 and $0.280
Disclaimer
The views and opinions stated by the author, or any people named in this article, are for informational ideas only, and they do not establish financial, investment, or other advice. Investing in or trading crypto assets comes with a risk of financial loss.




