
 Minter
 Quack AI
 STONK
STONK Pons
Pons Sui
Sui Pearl
Pearl Bittensor
•GRT/USD is currently priced at $0.13 and has decreased by 36.47% over the past 24 hours
•The trading volumes have increased by 56.74% in the last intraday session
•The technical indicators paint a hawkish outlook for the coin in the short term
Short Term View: No stopping GRT bears as the asset continues to fall
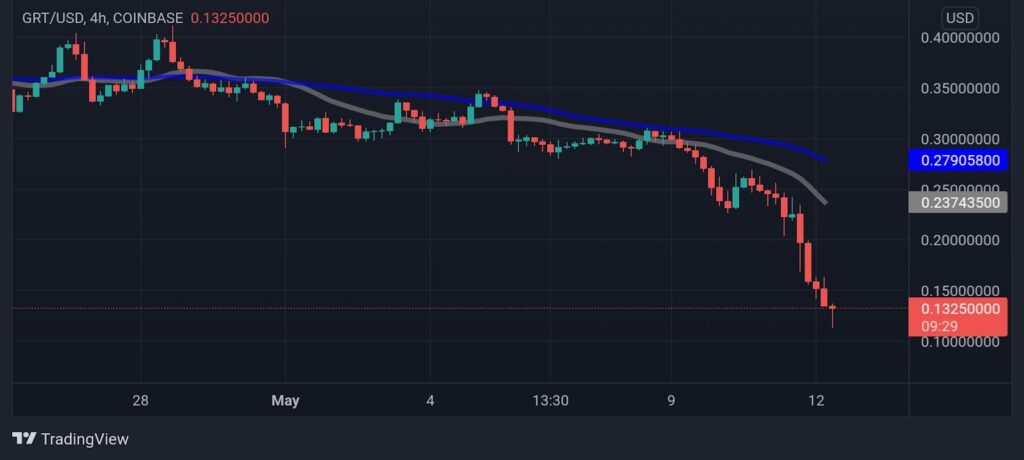
The Graph price today is $0.132806 USD with a 24-hour trading volume of $317,495,174 USD. The Graph is down 36.47% in the last 24 hours. The trading volumes have increased over the past day amid increased selling activity taking place at the current price levels. The Volume to Market Cap Ratio stands at 0.3465, reflecting the bearish hold that the bears currently have over the asset.
The Graph fiasco compounded the bearishness on Thursday, leading to the altcoin tanking over 36%. GRT is now struggling to break past the $0.15 mark and continues to form bearish market structures with lower highs and lower lows. The altcoin witnessed immense selling pressure over the past day, taking the altcoin prices significantly below the 20,50 SMA on the four hour chart. Until this bearish trend is broken, investors will continue to suffer with the next support level located at $0.10. On the flip side, a reclamation of the $0.20 resistance level is necessary for a reversal to occur.
Long Term View for GRT
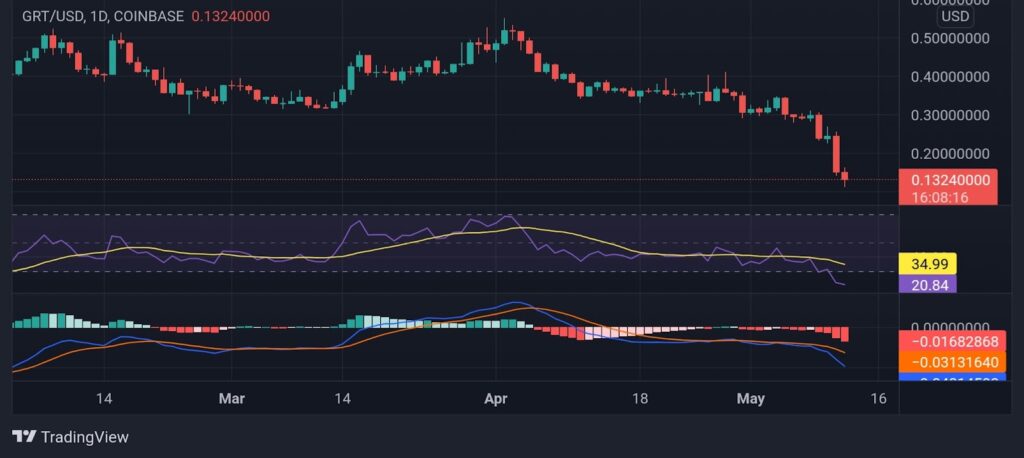
Across the technical indicators for The Graph, the MACD is currently bearish, as expressed in the red color of the histogram. Furthermore, the darker shade of the histogram shows an increasing bearish momentum, with the indicator showing the MACD and signal lines currently transacting in the negative zone, with the gap widening between the two. The RSI has been trading low in the oversold region over the past few days, currently transacting at 20.82. This shows a bearish trend across the daily charts which is unlikely to fade anytime soon.
Conclusion
Currently, The Graph bears are dominating the market as traders are selling in large quantities in order to escape a dying market. The technical analysis reinforces the bearish dominance while showing no signs of reversal anytime soon.
Support: $0.10-$0.05
Resistance: $0.20-$0.35
Disclaimer
The views and opinions stated by the author, or any people named in this article, are for informational ideas only, and they do not establish the financial, investment, or other advice. Investing in or trading crypto assets comes with a risk of financial loss.




