
 Celestia
 Pearl
Pearl Quantus
 Zcash
Zcash Hyperliquid
 Aerodrome Finance
 NEAR Protocol
- Optimism Price dropped below $2.00 and struggles to hold the swing low at $1.700.
- OP price struggles to defend the 200 day EMA.
- Optimism crypto eroded the returns generated in the past few months.
Optimism Price fell 6% approx on a weekly basis and also dropped below $2.00 which hurted the market sentiment. OP price has eroded the returns generated in the past few months and struggles to defend the swing low support.
Optimism Price dropped below the 50 day EMA and reversed the short term trend in the downward direction. However, buyers are trying to defend the 200 day EMA to keep the positional trend in the favor of bulls.
Optimism Price has tried multiple times to break the $3.00 hurdle level but gets rejected. It indicates strong sellers are active and bears dominating on the higher levels. However, the price is near to the demand zone and it will be difficult for bears to pull the prices below the support.
Optimism price is trading at $1.780 with an intraday decline of -5.67%. The 24 hour volume to market cap ratio is 0.1702. At the mid of March, OP crypto witnessed a massive spike in the buying volume. The prices reacted positively and bounced back after forming a bullish engulfing pattern.
It tried to break the $3.00 hurdle and expand upward but sadly prices lost the momentum and entered into the narrow range of consolidation. After consolidating for a few weeks, the slow and steady price began to decline and reverted in the downward direction.
Will Optimism Price defend the crucial support?
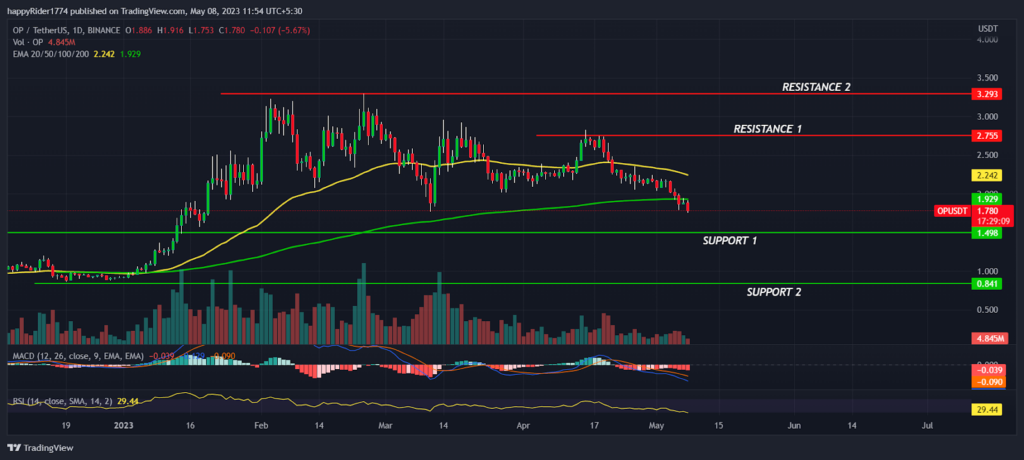
Optimism Price corrected 35% approx from the recent swing high at $2.755 and sell off is still continued. The overall market sentiment is also turning bearish which may negatively impact the sentiment of OP investors. Till the price is trading below $2.00 the probability of more downside is high.
However, If buyers succeed to defend $1.500 support then short term rebound is possible. On the other hand, if the sell off continues and price dropped below $1.500 then bears may try to drag it down to $0.800 level. The technical analysis suggests Optimism price is in correction mode and more downside is possible.
Will OP price break down the lower range?
OP price down by 18% approx on a monthly basis and forming a bearish pattern. Optimism price has consolidated in the wide range between $2.00 to $3.00 and is trying to break the lower range. It will hurt the market sentiment and invite further decline.
The technical indicators like MACD had generated a negative crossover and histogram bar is on decline. It indicates downward momentum might continue for some more time and prices are likely to trade with bearish bias. The RSI at 29 entered the oversold territory which is a hope for bulls and anytime it may trigger a relief rally from lower levels.
Conclusion
Optimism Price fell 6% approx on a weekly basis and formed a bearish pattern. The technical analysis suggests OP price is in correction mode and more sell off is possible.
However, OP price is near to the demand zone and buyers will try best to defend the $1.500 support.
Technical levels
Resistance levels : $2.755 and $3.300
Support levels : $1.500 and $0.800
Disclaimer
The views and opinions stated by the author, or any people named in this article, are for informational purposes only. They do not establish financial, investment, or other advice. Investing in or trading crypto assets comes with a risk of financial loss.




