
 AudaCity
 Bitcoin
 Lighter
 Pearl
 Pons
 Ondo
 NEAR Protocol

- SHIB token shows volatile move registering breakdown on charts.
- Buyers were willing to pause the selling pressure in the last trading hours.
Shiba Inu token looks bearish and noted with a breakdown on the charts, aggressive selling pressure resumes on the token. Moreover, any hope of bounceback is not confirmed based on price action, as a short buildup was noticed on the charts.
Furthermore, the price trades below the congestion zone of $0.00000900 and the significant moving averages. SHIBA token needs to fetch a 20-day EMA to avoid intense selling. However, price action indicates that sellers charged with increased trading volume and building short positions were seen on charts when the token broke the consolidation zone.
When writing, the SHIB token trades at $0.000008902 with an intraday gain of 0.77%. Moreover, the trading volume rose by 2% in the intraday trading session. SHIB token remained bearish until the mark below $0.000001000, and selling pressure resumed on the token. Above the mark, buyers will gain strength, and a short covering can be seen.
Shiba Inu Daily Charts Shows Breakdown
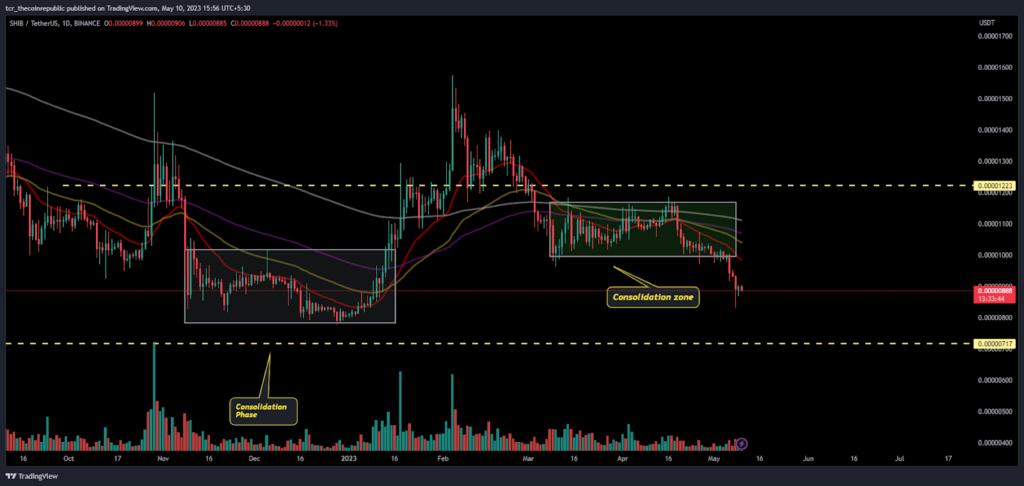
On the daily chart, the SHIB token remains bearish, and sellers attain more strength in the last few sessions, as the token slips below the 20-day EMA signifies more bearishness.
Recently, the Shiba Inu token eroded its shine compared to the past weeks, when SHIB looked attractive and was an investor favourite meme coin. Things changed, and the meme coin lost the pace of action from the last few months after the Shibarium launch. Recently, newly launched meme coins got traction in price, and investors need to get more attention to the SHIB token, resulting in a price drawdown and loss in momentum.
As per the FIb levels, the SHIB token trades near the trajectory below 23.6% and cannot attain grip loss continuously. Moreover, the price slipped below the lower Bollinger band, and no signs of reversal arose. The investors remain cautious based on the volatile action of the token in the past few sessions.
What Traditional Indicator Says?
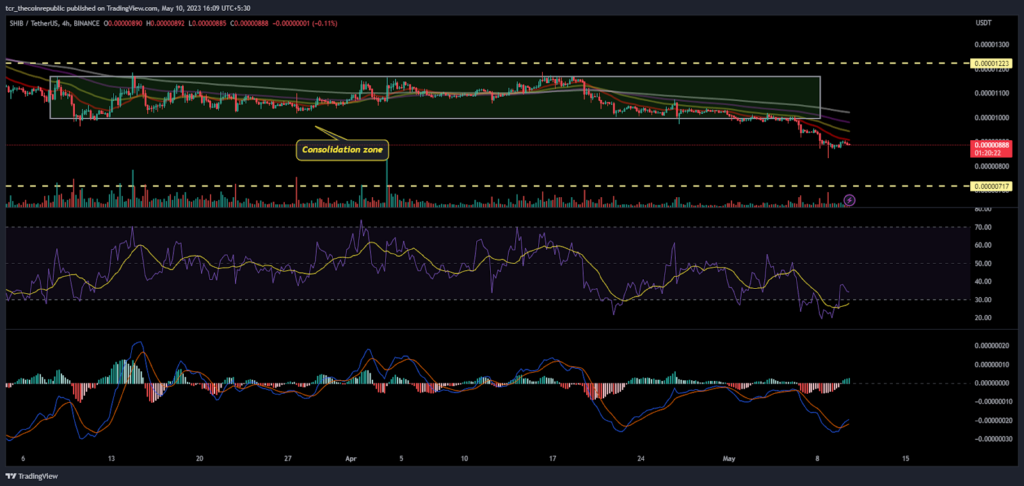
On the 4-hour charts, the SHIB token shows a bearish and pessimistic outlook based on the recent breakdown on the charts. However, the RSI curve tried to attempt a bounce from the oversold region, and a positive crossover was also seen on the index.
The MACD indicator also noted a bullish crossover, but the trading volume needs to surge to get traction in price.
Moreover, the recent swings indicated that a bounce is pending before the further drop in prices, so buyers need to be more attentive in the upcoming sessions for making new positions.
Conclusion:
SHIB token remained under the hands of bears and stayed below the neutral marks.
Technical Levels:
Support Levels: $0.000008800
Resistance Levels:$0.000001000
Disclaimer
The views and opinions stated by the author, or any people named in this article, are for informational purposes only and do not establish financial, investment, or other advice. Investing in or trading crypto assets comes with a risk of financial loss.