Universal High Income
 OnlyAgent
 Aerodrome Finance
 Monero
 Pearl
 Axis Robotics
 Quantus

ICX, the native token of the platform ICON, has been in a downtrend since the month of March 2023 when it created a high at $0.4765. This decline in price was due to the double top pattern which is a trend reversal pattern formed in the month of April and the price has been falling ever since.
- ICX/USDT has been trading with bearish price action over the last couple of months
- ICX/USDT is at a very crucial support zone on the daily time frame
ICX price is trading at $0.1738 which is around the daily support level of $0.1766.When last time the price came to this level, which was during March, it saw a very strong bull run which made a rally of 170%, making it a significant demand zone.
Daily chart shows price at a crucial support
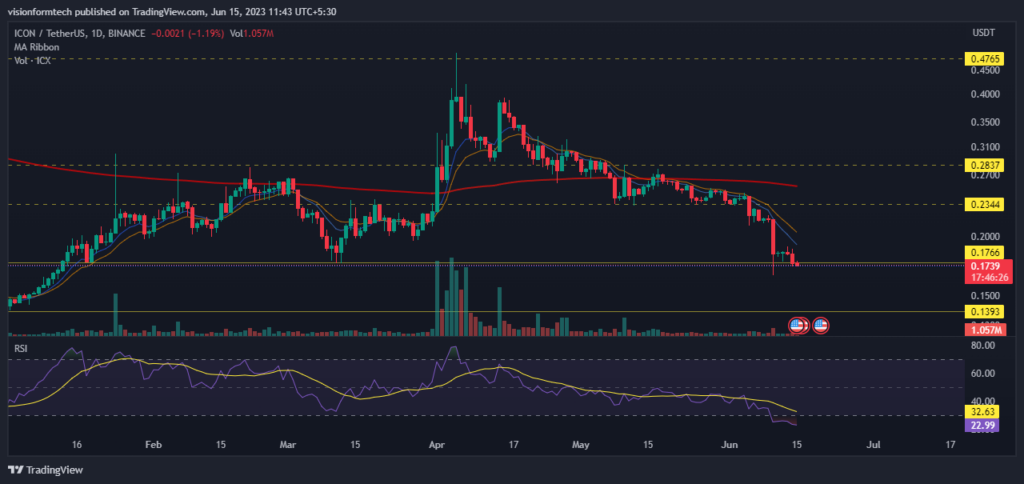
On the daily chart, ICX is in a downtrend. The price was forced to decline due to the increased selling pressure just after it broke the daily support zone of $0.2344. After the breakdown, the price saw a sharp decline of 24.30%. At present ICX is trading at the daily support. It briefly breached the level, however, the bulls immediately pushed the price above the support.
It is important to note that if the daily candle closes below this level, this will create selling pressure that might push the price further down. In this case, a downfall can be expected towards its next support which is another 20% decline. Since the price is below 200 EMA, Investors must remain cautious as this represents that bears are in control.
Short Term Charts show strong bearish momentum
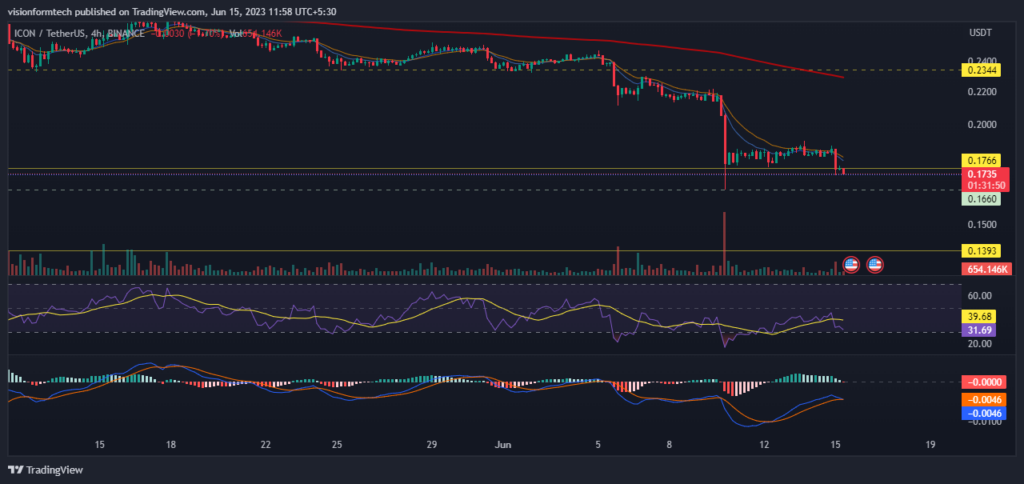
The 4H Chart is representing a strong downtrend with high-volume selling. As the price rests on an important support zone, investors must remain cautious due to uncertainty of the direction in which the price might decide to go. At present the price is consolidating before making a move in either direction.
A daily close below the support will give more confirmation of the downside. Although, the market is bearish but it is on the support. Investors must look out for confirmations in case of reversals as it could be possible from what is concluded by the past data
RSI: The RSI indicator is currently at 31.65 and the RSI has crossed the MA line towards the downside which is indicating that bears are controlling the market.
MACD: The MACD indicator briefly made a bullish crossover but is already losing momentum and is about to cross in the downward direction.
200 EMA: As it is observed, on the 4hr, the price is trading below the 200 EMA(exponential moving average) which acts as a significant resistance. This is a clear indication of a downtrend where the sellers are in control and in order for a trend reversal, the price must break and trade above the 200 EMA.
Technical levels
Support Levels:$0.1660
Resistance Levels: $0.2344
Conclusion
ICX/USDT is trading in a Bearish price action for the past 2 months. The price is at an important support level. If the bulls fail to defend this level, it will create a selling pressure in the market which might force the price to test lower levels. In the case of a reversal, the price should trade above resistance and 200 EMA in order to change the sentiments of the market.
Disclaimer
The views and opinions stated by the author, or any people named in this article, are for informational purposes only and do not establish financial, investment, or other advice. Investing in or trading crypto assets comes with a risk of financial loss.