
 streamoors
 IGNITION
 Injective
 Quantus
 NEAR Protocol
 Pearl
Pearl LayerZero
- FLOKI is currently trading at $0.00002231 with a rise of 1.89% in the 24 hours.
- FLOKI’s live market cap is $221768161.
- FLOKI faced a massive decline of -20.73% in the last 7 days.
Introduction
FLOKI is a popular cryptocurrency among the people. FLOKI was originated by fans and members of the Shiba Inu (SHIB) community and the FOLKI name is also inspired by Shiba Inu. Floki is a decentralized community-run project.FLoki was introduced by an unknown personality but then it was hijacked by the community and relaunched this project. Folki has a huge fanbase like Shiba Inu and it also gets support from the community. The use cases of Folki in NFTs, games, and decentralized finance features.
Trend Analysis
By studying historical price data, we can say that FLOKI is in a downtrend currently. The price declined -20.70% in the last seven days and it can be said that FLOKI is underperforming right now.
FLOKI Price Analysis
EMA: FLOKI Price is currently trading below the 100-day EMA and 50-day EMA on the daily time frame, which is a negative sign. Investors’ sentiments regarding FLOKI are negative and are on the selling side.
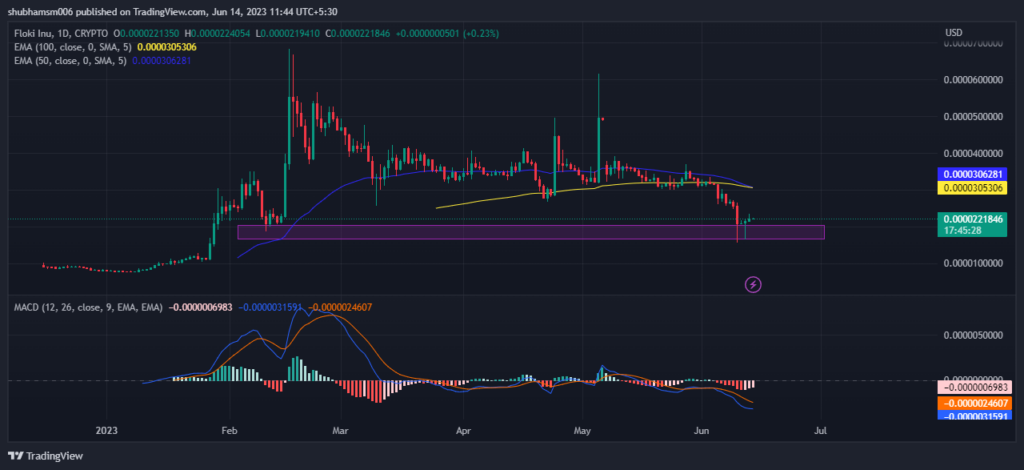
MACD: Moving average convergence divergence is giving negative signal regarding the coin. The MACD line at -0.00000031591 and signal line at -0.0000024607 are below the zero line which suggests the MACD is in negative territory and giving the bearish signals.
RSI: The current value of RSI is 31.26 points and the 14 SMA line is currently below the median line around 36.02 points which shows bearish sentiment in the market. The 14 Day SMA line is below the median. It indicating a negative trend or bearish sentiment in the market. The price is currently at an oversold zone.
Stochastic RSI: In the stochastic RSI, the %d line is at 12.29 and the %k line is at 20.26 points. The %d line indicates that RSI is in the overbought area while % k line shows adverse sentiments regarding the price.
Volume Analysis: FLOKI trading volume of 24 hours is $19.61 million with a circulation of 9.209T.
Conclusion
FLOKI’s price presently shows a pessimistic approach in the near future. Major indicators like EMA, RSI, and MACD are showing negative signs in the FLOKI coin and investors are also not showing any big buying interest. This could be happening due to the negative performance of the coin in recent times.
Technical levels:
Support – The current support level of FLOKI is $0.0000200542.
Resistance –The current resistance level of FLOKI is $0.0000472614.
Disclaimer
The Current analysis is given for informational purposes only .This information should not be considered as financial, Investment, or other advice. Investing in or Trading Crypto assets comes with a risk of financial loss. Please consider your circumstances and risk profile before making any investment decisions.




