
 Dacity Coin
 Injective
 Pearl
Pearl Bittensor
 Pudgy Penguins
 Celestia
 NEAR Protocol
- TWT/USDT has broken from a trendline in the daily time frame
- TWT/USDT is down 41% from breaking the trendline
After a breakdown from a major trendline, price consolidated for the past few months and eventually declined at the current price level of $0.7572. This drop is indicating the price might test lower levels in the upcoming time.
TWT price is trading at $0.7572 after breaking down from a major trendline which had become significant support since the last year. This Breakdown pushed the price down 41% so far and there is a high probability that the price can decline to its next support at $0.5439 which is a drop of almost 27%
The daily chart shows an overall bearish trend
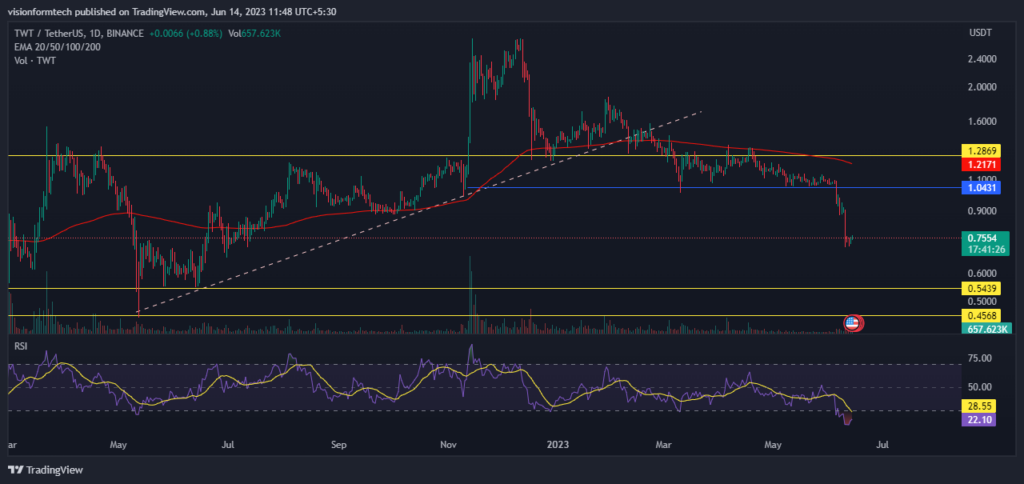
On the daily chart, the current price action of TWT/USDT, shows a high probability of further downfall to its primary support zone at $0.5439. This is a clear sign that the bears are in control of the market. TWT was in a consolidation phase since March where the price was taking support at $1.0431 but it took a major fall just after breaking it on the 5th of June.
TWT is below the 200 EMA Indicating a bear trend on the daily timeframe.
Short Term Charts show a moderate bounce
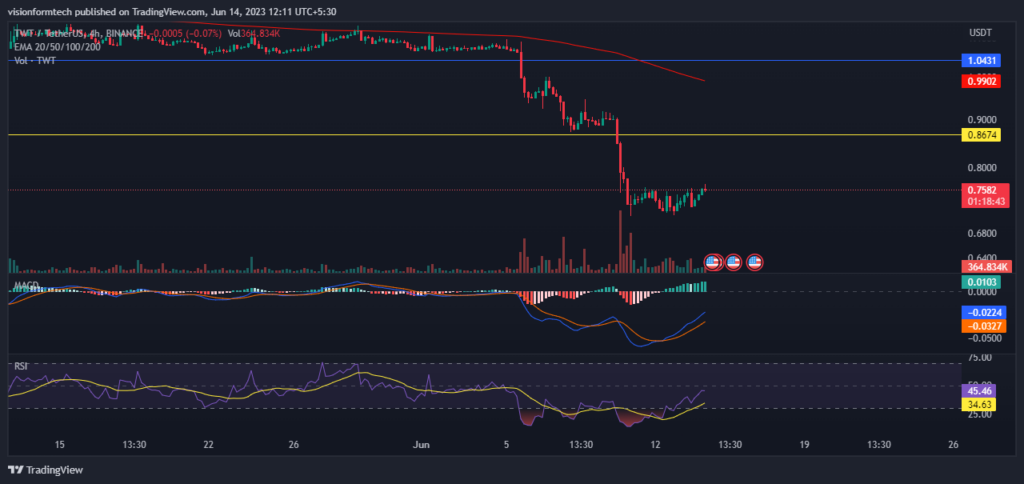
On the Shorter Time frame, the 4H chart price action is suggesting a minor pullback in a downtrend and overall the present market sentiments are very bearish. Price is currently below 200 EMA on daily and 4hr time frames indicating a downtrend and the bulls are now showing interest.
A short term consolidation is expected after the recent volatility. The bears are currently in control of the market while the bulls are finding it difficult to defend these levels. Sellers must watch out for some bearish patterns such as a bear pennant or a rising wedge to capture a decent move. On the upside, the bulls should consider the flipping of 200 EMA as a favorable condition to buy
RSI: The RSI indicator is currently at 46.14 which indicates that the strength is low in the market and the bears are in control
MACD: The MACD indicator has made a Crossover but the price didn’t show a significant rise which means that the sellers might be booking profits but aggressive buying is missing.
200 EMA: As it is observed, on the 4hr, the price is trading below the 200 EMA(exponential moving average) which acts as a significant resistance. This is a clear indication of a downtrend where the sellers are in control and in order for a trend reversal, the price must break and trade above the 200 EMA.
Conclusion
The Price prediction for TWT is suggesting a bear trend and a probability of further downfall as the nearest primary support zone is still 27% down and bulls will not show major interest until it reaches the support level. Therefore investors must watch the price for the further downfall and potential buying opportunities near the support zone.
Technical levels
Support Levels:
$0.5439 – Support 1
$0.4568 – Support 2
Current Price: $0.7572
Resistance Levels:
$0.8674 – Resistance 1
$1.0431 – Resistance 2
Disclaimer
The Current analysis is given for informational purposes only .This information should not be considered as financial, Investment, or other advice. Investing in or Trading Crypto assets comes with a risk of financial loss. Please consider your circumstances and risk profile before making any investment decisions.




