
 streamoors
 Sword Inu
 Altai the Tiger
 IGNITION
 no crying in the casino
 NEAR Protocol
 Pudgy Penguins
- HIVE/USDT is down 2.0% since the start of the day
- HIVE is under bearish influence which caused a fall of 43% from the resistance
HIVE witnessed aggressive selling over the last couple of months after creating a high at $0.4908 which served as a strong resistance. The price has been declining after facing rejection from this level.
HIVE/USDT is trading at $0.2758 after it saw a rejection from the daily support level of $0.4908. This rejection gave the bears a strong confidence that led to massive selling in the market and the price dropped 43%. The level of $0.3244 was the last hope for the bulls but couldn’t hold the price there. At present the price is at an important demand zone which is between $0.2782 and $0.2502.
Price is at an important demand zone
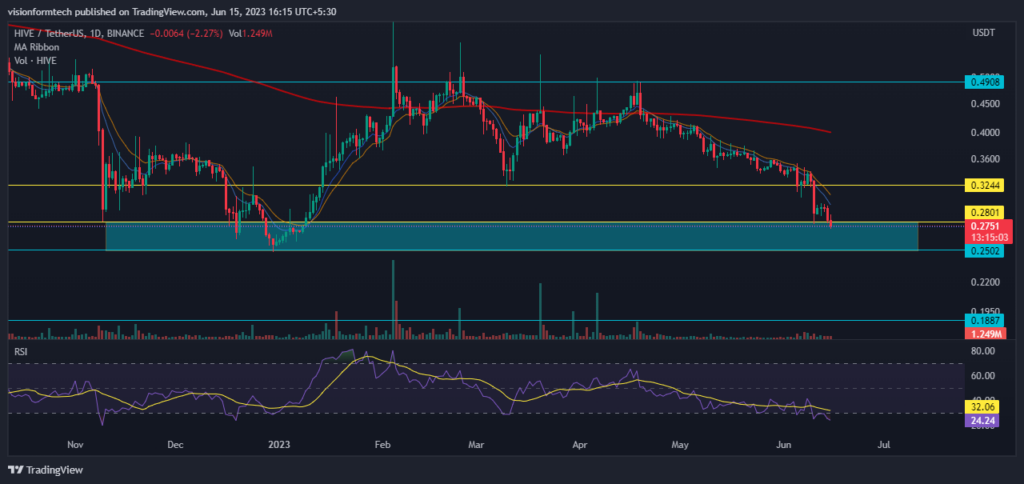
The Daily chart is showing a downtrend. The technical indicators also convey the same message. The current level of the price is important because buyers pushed the price from here in the past. If any daily candle closes below this zone, $0.2502 to be precise, this will trigger a panic selling which can push the price to the level of $0.1887. This downfall is approximately 24%.
Since the price is in the demand zone, there is an equal probability of reversal from here. In this case, the price will face resistance at $0.3244 along with the 200 EMA
The Short Term Chart shows a clear downtrend
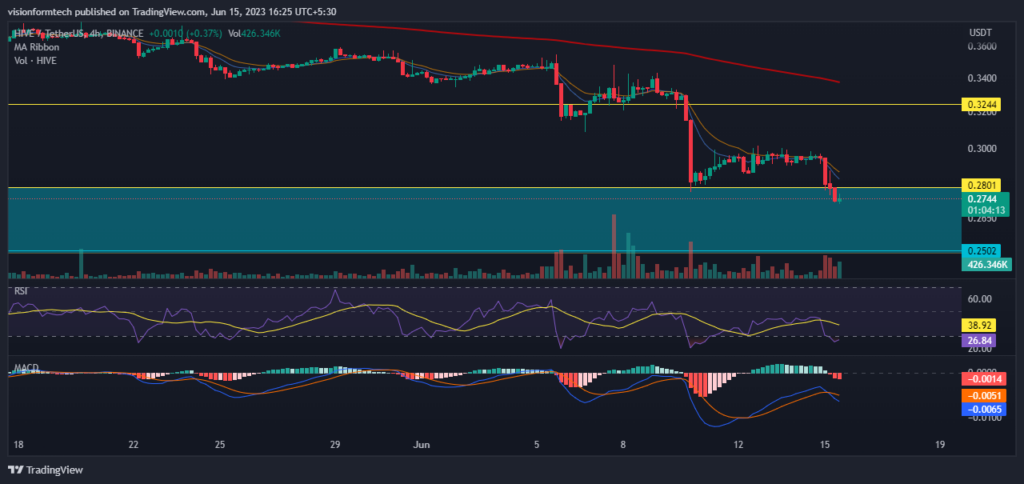
The 4H timeframe shows a perfect market structure of a downtrend. Presently the price is creating a new low which is an impulsive move after a corrective move. But if you notice closely The RSI is showing signs of bullish divergence because it’s moving in contrast to the price creating a higher low. This is indicating that the sellers are losing momentum. But investors must wait for more signs of reversal before making any investments.
RSI: The RSI indicator is currently at 26.67 and the RSI has crossed the MA line towards the downside which is indicating that bears are controlling the market. It is also representing an oversold condition.
MACD: The MACD indicator briefly made a bullish crossover but, is already losing momentum. It is about to cross in the downward direction. MACD is below the zero line
200 EMA: As it is observed, on the 4hr, the price is trading below the 200 EMA(exponential moving average) which acts as a significant resistance. This is a clear indication of a downtrend where the sellers are in control and for a trend reversal, the price must break and trade above the 200 EMA.
Conclusion
HIVE is in a downtrend and trading in an important demand zone. There is a 50-50 chance of reversal and a breakdown. Investors will be watching this level closely as this could interest both buyers and sellers. A daily candle close below the demand zone will reduce the chance of reversal. In the case of an upside, buyers should watch for any bullish candle or a pattern such as a hammer or double bottom. Also, the daily 200 EMA is a strong indicator to spot trend reversal.
Technical levels
Support Levels: $0.2502 – Support 1
$0.1887 – Support 2
Current Price: $0.2578
Resistance Levels: $0.3244
Disclaimer
The Current analysis is given for informational purposes only .This information should not be considered as financial, Investment, or other advice. Investing in or Trading Crypto assets comes with a risk of financial loss. Please consider your circumstances and risk profile before making any investment decisions.




