
 Dacity Coin
 streamoors
 Pudgy Penguins
 Injective
 Celestia
 Sui
Sui Pearl
Pearl
- NEAR protocol showed a downmove below $1.400.
- Bulls are unable to maintain the gains in the last sessions.
NEAR Protocol showed a downtrend and sliding below the crucial support mark below $1.500, which was the range of buyers, but sellers with strong potential led the downmove. Moreover, the price action showcases that bulls are feeling an intense selloff from the supply range of $2.000.
With the market sentiment and the ongoing correction in the crypto market, NEAR protocol also affected this and corrected by more than 10% this month. However, pressure on the bulls led to a steep decline with the lower lows sequences formed on the chart.
However, the price action showed that if follow-on selling arose, then NEAR could break its immediate support mark of $1.200 and headed towards the round mark of $1.000. On the other hand, if any bounce was happening in the next sessions, the immediate resistance is at $1.500, which acts as a barrier for the buyers. Moreover, the trajectory swings are suggesting that the recent downfall has led to retested the base of $1.100 and a retracement was noted on the charts with the intraday gain of 5.30% showing the bulls accumulation.
When writing, NEAR is trading at $1.26 with an intraday gain of 5.40%, showing a retracement in the form of lower highs, but stayed in the seller’s region. Moreover, the trading volume also showed an upside of 3.30% at $84.00 Million, showing interest of investors. The market cap of NEAR is $762.76 Million.
The intraday high of NEAR is $1.276 and the day low is at $1.183.
Daily Charts Shows Low Demand of NEAR
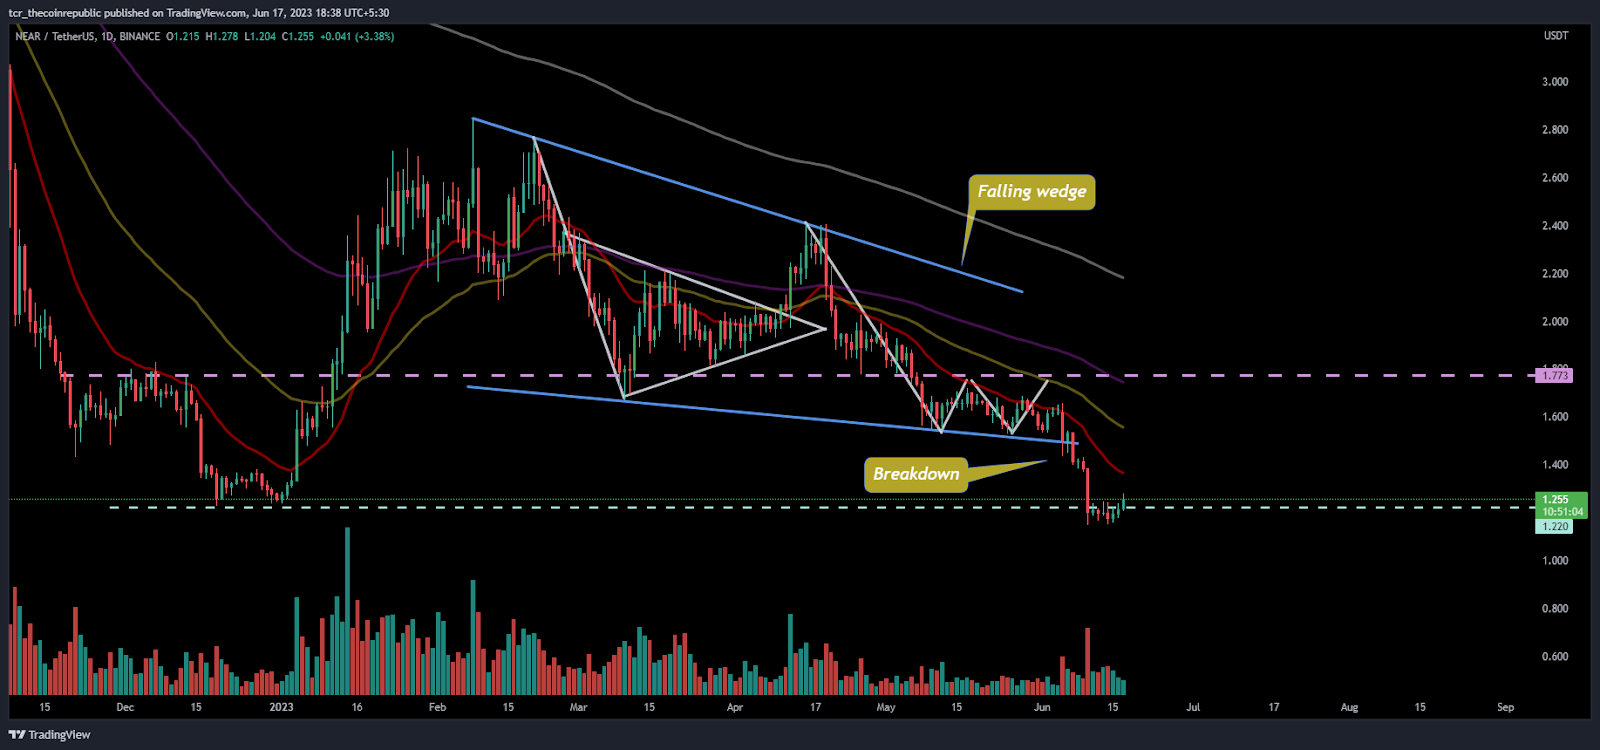
On the daily charts, NEAR protocol was in a downtrend and continued to slide from the supply region of $2.000. The mighty bears continued to make short positions and resulted in the corrective move of the token. Furthermore, the chart showcased a falling wedge pattern which suggested a reversal and a bullish view, but instead of going on the uptrack, price took a return from the upper trendline and broke the support below $1.700 and took a sharp downmove showing aggressive selling.
As per the Bollinger band and Fib level indications, NEAR is on the verge of the lower Bollinger band and a bounce was noted on the charts.Furthermore, NEAR token price also trading below the 23.6% Fib level shows the negative view in the next sessions based on the hawkish selling in the token.
What NEAR suggests on short term charts?
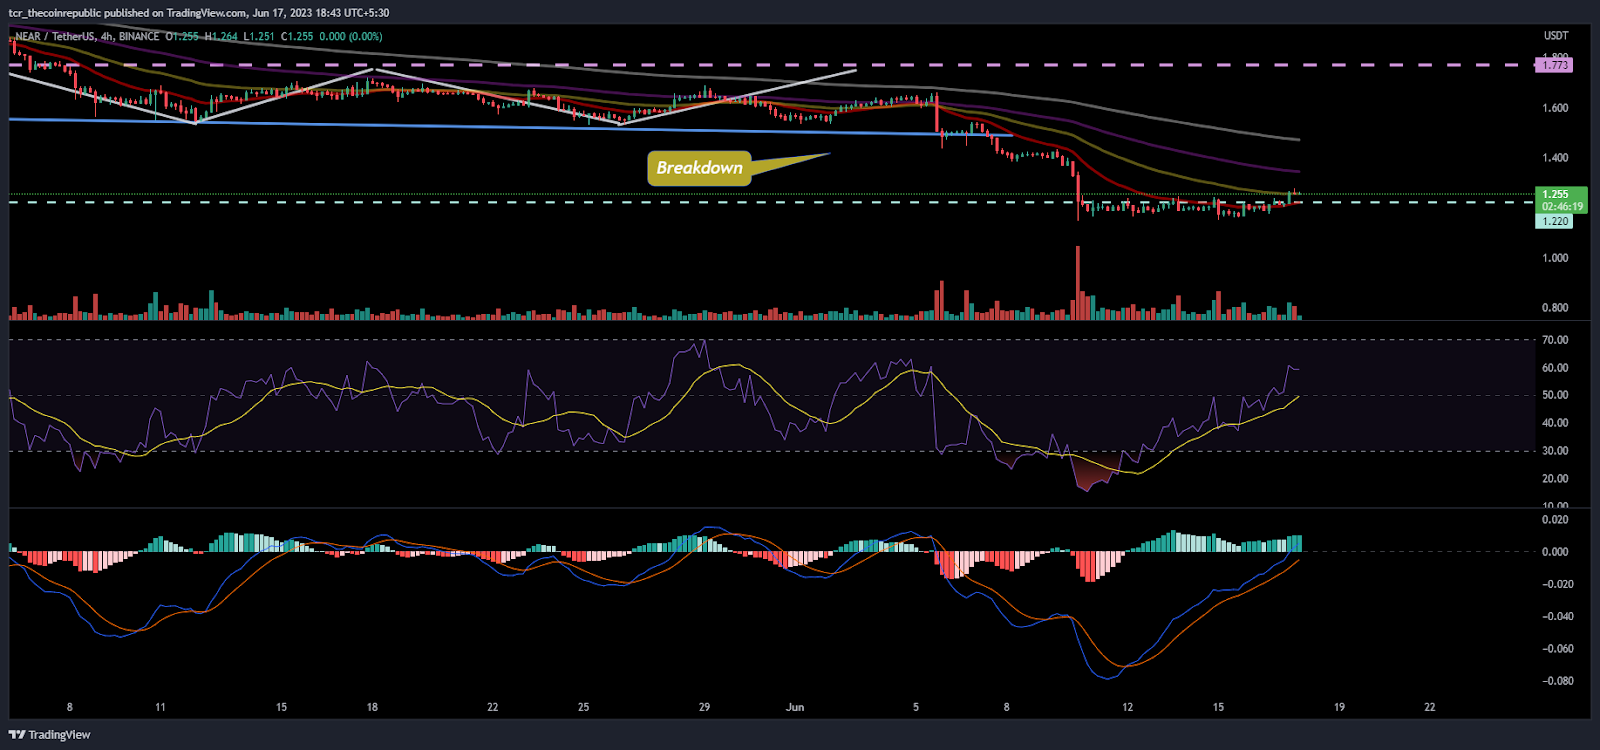
On the 4-hour charts, NEAR token is consolidating amid the breakdown in the last sessions and stayed near the demand zone waiting for a follow on buying action. The buyers are pumping the gains and rescuing the muscles to attain the gains again.
The RSI showed a sharp bounce from the oversold region and noted with a positive crossover indicating a trend reversal move. The curve is sustaining above the neutrality of 55 indicating the bulls are showing their best.
The MACD indicator also began to show green bars showing reversal indications with a bullish crossover.
Conclusion:
NEAR protocol price is trying to accumulate from the lows and seeking to attain fresh momentum amid the correction in the price.
Technical Levels:
Support Levels:$1.100
Resistance Levels:$1.600 and $2.000
Disclaimer
The views and opinions stated by the author, or any people named in this article, are for informational purposes only and do not establish financial, investment, or other advice. Investing in or trading crypto assets comes with a risk of financial loss.




