
 Dacity Coin
 streamoors
 astronaut
 Injective
 Celestia
 Pudgy Penguins
 Sui
Sui
- APE showed an intense selloff and continued to fall.
- Bulls are noted with long unwinding activity in the last trading sessions.
Apecoin showed headwinds and continued to fall without taking a pause after the breakdown of the support mark $3.50, below the neckline of the descending triangle pattern. The mighty bears have noted in a strong action and gained extreme momentum resulting in the downtrend of the coin with massive seller volumes. Moreover, APE is showing a negative outlook based on the panic selling in the coin.
However, the price action showed that if follow-on buying was arised, then APE faces immediate resistance of $2.400, which was the previous support, but now flipped as a resistance now.
The price action shows that APE is in a downside territory where more declines have opened and buyers are not taking much interest due to the momentum shifting in the favour of sellers and coin is in the hands of sellers who continue to devote their best in the form of decline.
When writing, APE is trading at $2.14 with an intraday gain of 2.40%, showing a retracement in the form of lower highs, but persisting in the bearish outlook, but selling pressure was still reflecting on the charts, and more downside is still possible. Moreover, the trading volume also showed an upside of 11.30% showing sellers interest.
Daily Charts Shows Extreme Downtrend
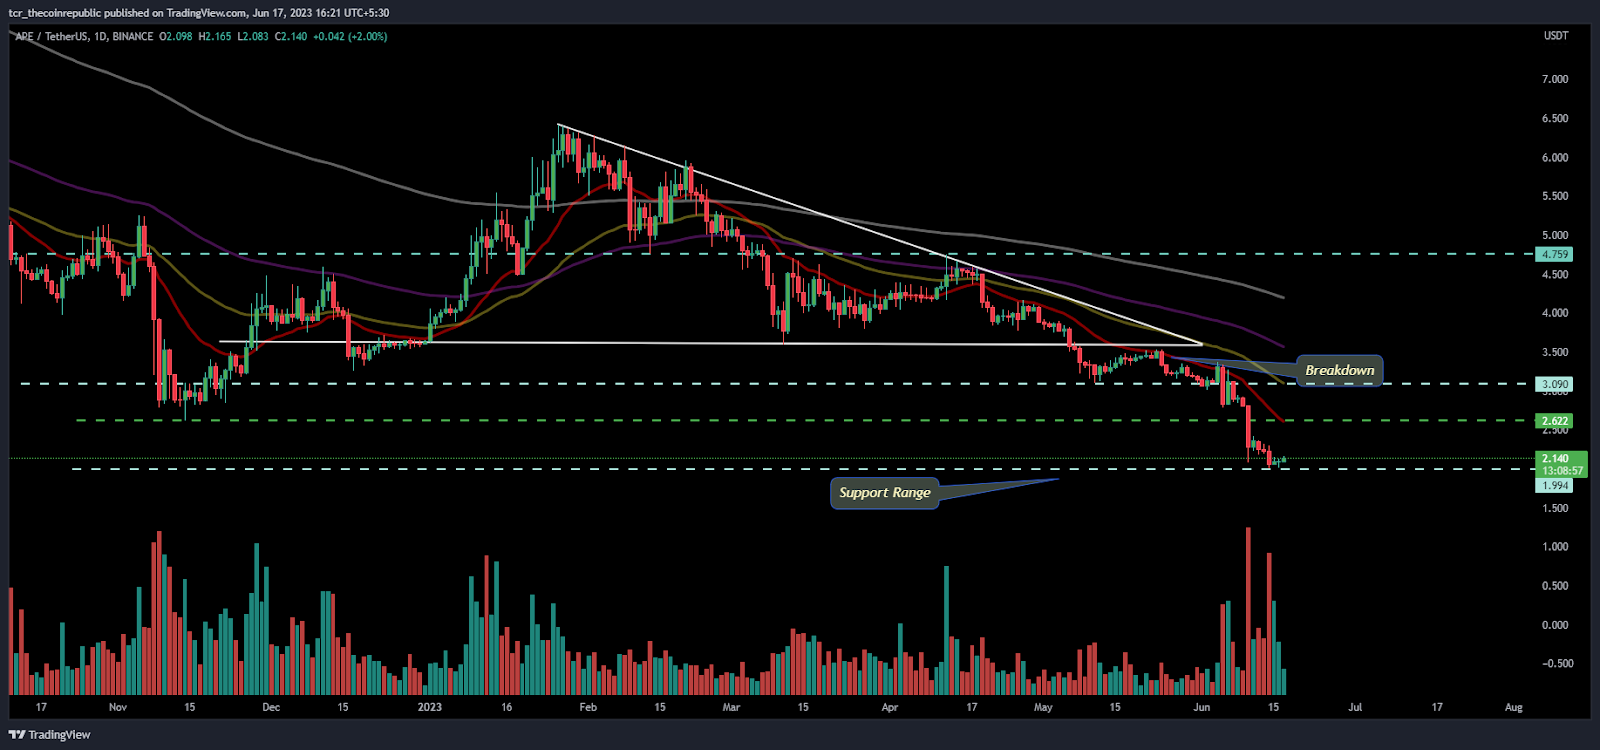
As per the price action, APE faced the selloff right from the top range near $5.00 and continued to form lower lows sequence from there where buyers have faced gradual decremental move and a profit booking move led to a sharp move when it broke the neckline of $3.50.
On the daily charts, APE showed a breakdown from the strong support of $3.20, and continued to slip further and headed toward the demand zone of $2.00 which was retested in the last sessions and attained accumulation from there.
As per the Bollinger band and Fib level indications, APE broke the lower Bollinger band in the last session, and a quick bounce was noted. Furthermore, APE also slips below the 23.6% Fib level, resulting in the intense selling pressure in the coin.
What does APE suggest on 4 hour charts?
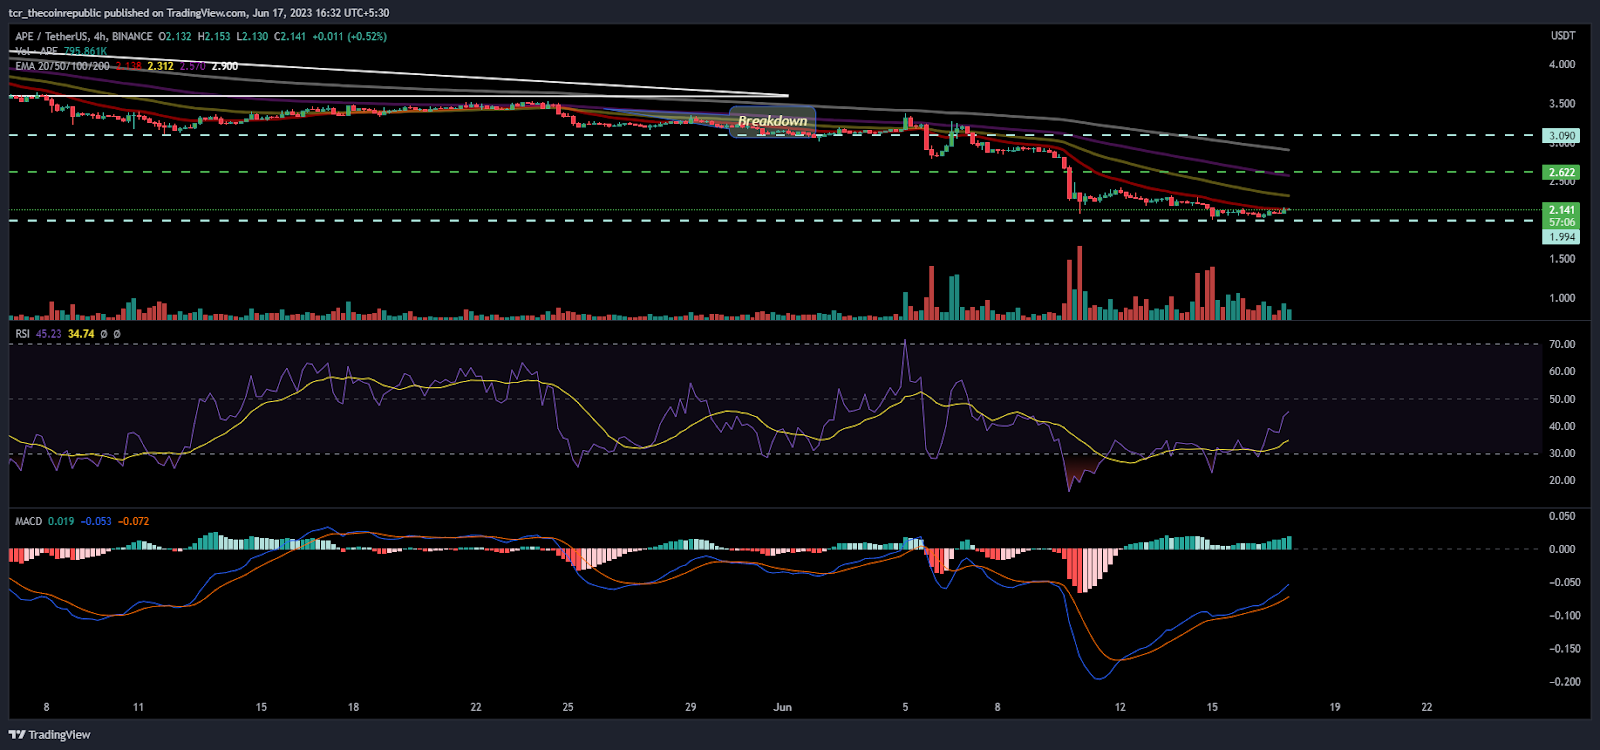
On the 4-hour charts, Apecoin shows a reversal from the demand zone of $2.00 and the bulls were trying to accumulate the coin and willing to grab the neutral mark at $2.60 soon.
The RSI showed a bounce from the oversold region and noted a buying province amid the breakdown. The curve is near to 40 and slowly rising towards 50 at the neutral mark.
The MACD indicator also began to show green bars showing reversal indications with a bullish crossover.
Conclusion:
Apecoin shows bearishness and struggling near the demand zone, which shows that the presence of sellers are there and buyers feel lower strength near the bottom zones.
Technical Levels:
Support Levels:$2.00
Resistance Levels:$2.60 and $3.00
Disclaimer
The views and opinions stated by the author, or any people named in this article, are for informational purposes only and do not establish financial, investment, or other advice. Investing in or trading crypto assets comes with a risk of financial loss.




