
 Minter
 Quack AI
 Starknet
 NEAR Protocol
 Sui
Sui Hyperliquid
 Bittensor
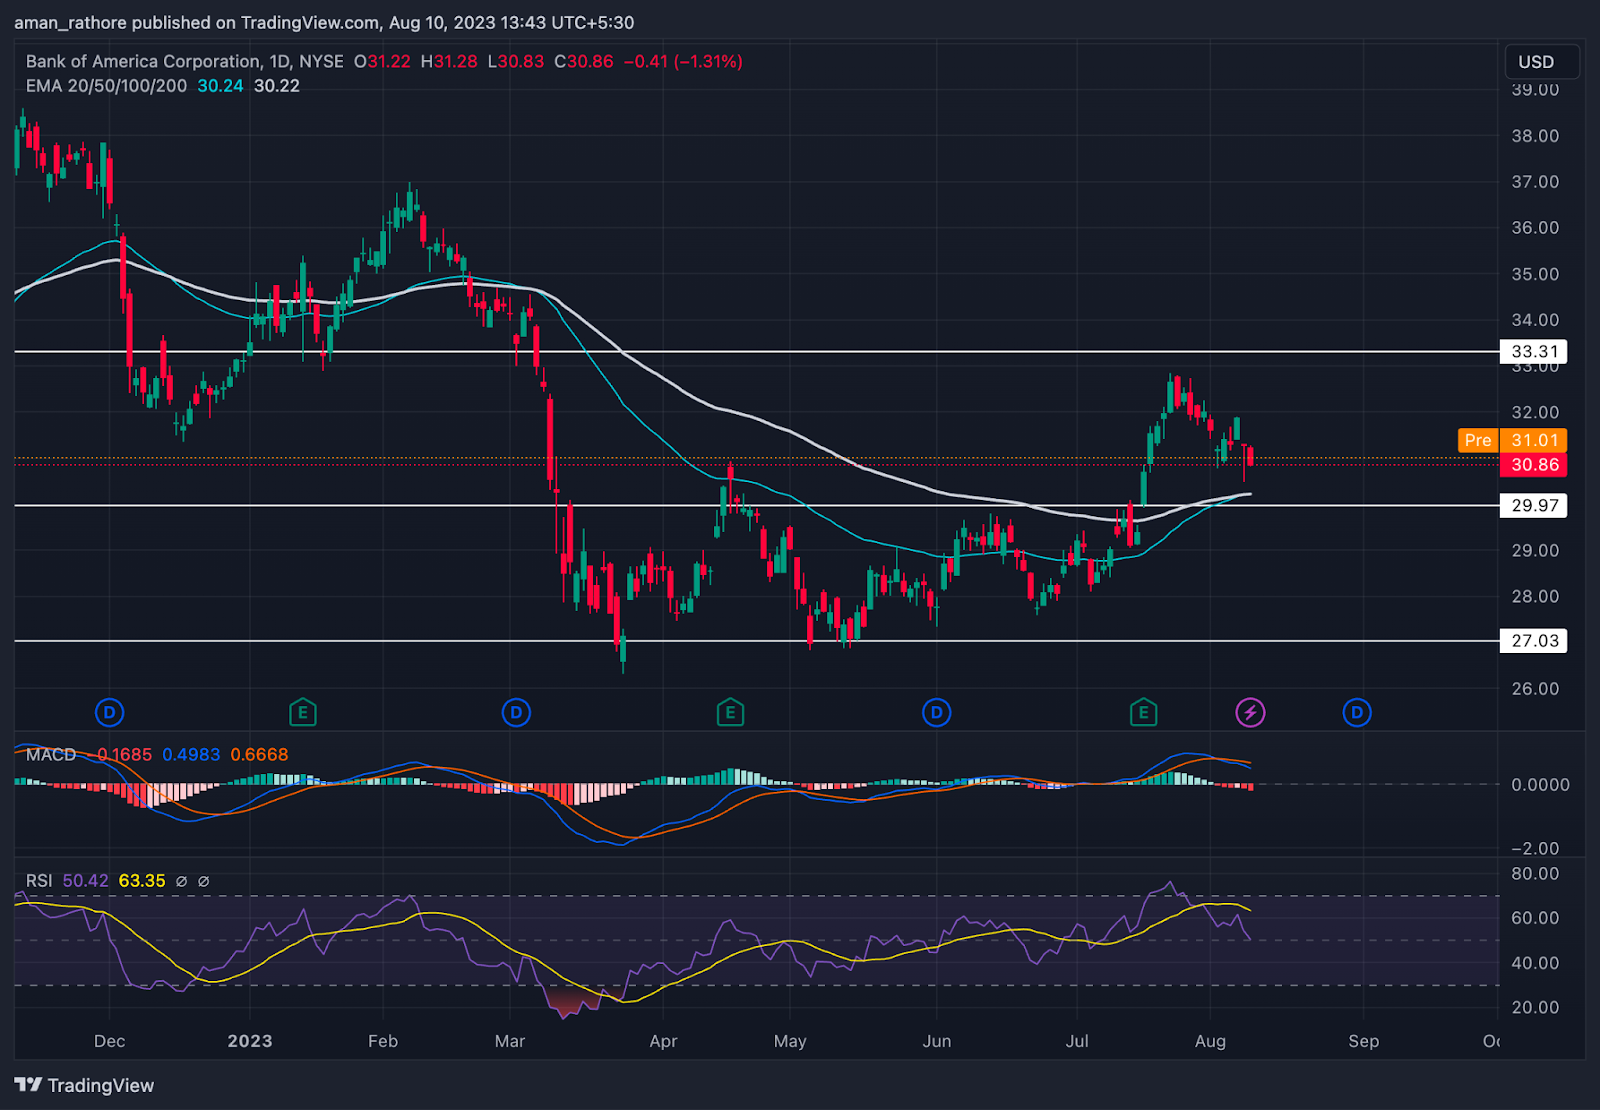
- Bank of America’s stock price is above 50-day and 100-day EMA levels.
- Bank of America stock is currently trading at $30.86.
- BAC live market cap is $245 Billion.
Bank of America stock is moving in an uptrend direction. The price of BAC is forming a higher high pattern with a good volume.
The BAC stock has a market capital of $245 Billion and the EPS of the stock is $3.45 per share. The stock of BAC has a 52-week high of $38.6 and a 52-week low of $26.3. Also, the P/E of Bank of America is 8.87.
The dividend yield ratio of the Bank of America stock is 3.3% whereas the industry average is 3.1%. The dividend payout ratio of the BAC stock is 29% and the stock pays a dividend every quarter.
After reaching a peak of $50.11 in February 2022, the price of Bank of America (BAC) shares fell rapidly by over 45% over the following one-and-a-half years. The stock, however, found support at the $27 level and the stock consolidated for a while in a range.
The stock displayed a breakout from a range with notable momentum. The price of BAC’s shares increased by 7% over the past four trading days and by 16% over a month.
The price forecast for the BAC stock appears to be generating a bullish momentum following the breakout from an important point of resistance. The stock’s general structure is strong, and new swing highs in the price are likely.
Bank of America (BAC) Stock Price Analysis
EMA
The stock price of Bank of America is trading above the 50-day and 100-day EMA. This indicates that the stock is in a bull run and forming an uptrend pattern.
MACD
The Bank of America (BAC) stocks MACD line is trading above the signal line, supporting the upward trend. This suggests that the stock price will probably increase during the next few days.
RSI
Currently, the RSI line for the BAC stock is at level 74, and the SMA line is at level 61. This indicates that the stock price is in uptrend momentum and price is likely to rise in the upcoming days.
Conclusion
As per the analysis the stock of Bank of America is in uptrend momentum.. The stock price is expected to increase in the future as it is now creating a higher high pattern. Future upward movement is also being predicted by indicators like MACD, RSI, and EMA.
Technical Levels
- Support Level: $29.97.
- Resistance Level: $33.3.
Disclaimer
The views and opinions of the author, or anyone named in this article, are for informational purposes only. They do not offer financial, investment, or other advice. Investing or trading crypto assets involves the risk of financial loss.




