
 Minter
 Sui
Sui Pons
Pons NEAR Protocol
 Starknet
 Quack AI
 Chainlink
- BOOHOO stock price is currently trading at $39.16.
- BOO stock has shown signs of reversal.
BOOHOO Group Plc was founded in 2006 by Mahmud Abdullah Kamani, Wallis, and Burton. The stock is a UK-based online fashion retailer which deals in the online retail of clothes and accessories. They design, source, market, and sell fashion and beauty products for their target audience of 16-45 year olds.
Fraser Group raised their stakes to about 1% in BOOHOO for the strategy of building support and position in attractive companies which led to the rise in the price of BOOHOO stock on 26 July, 2023. They disclosed that they raise a m their 7.8% stake in BOOHOO as of July 26, 2023 from their prior stake of 6.78%.
Will the Price of BOOHOO Seen in High Again ?
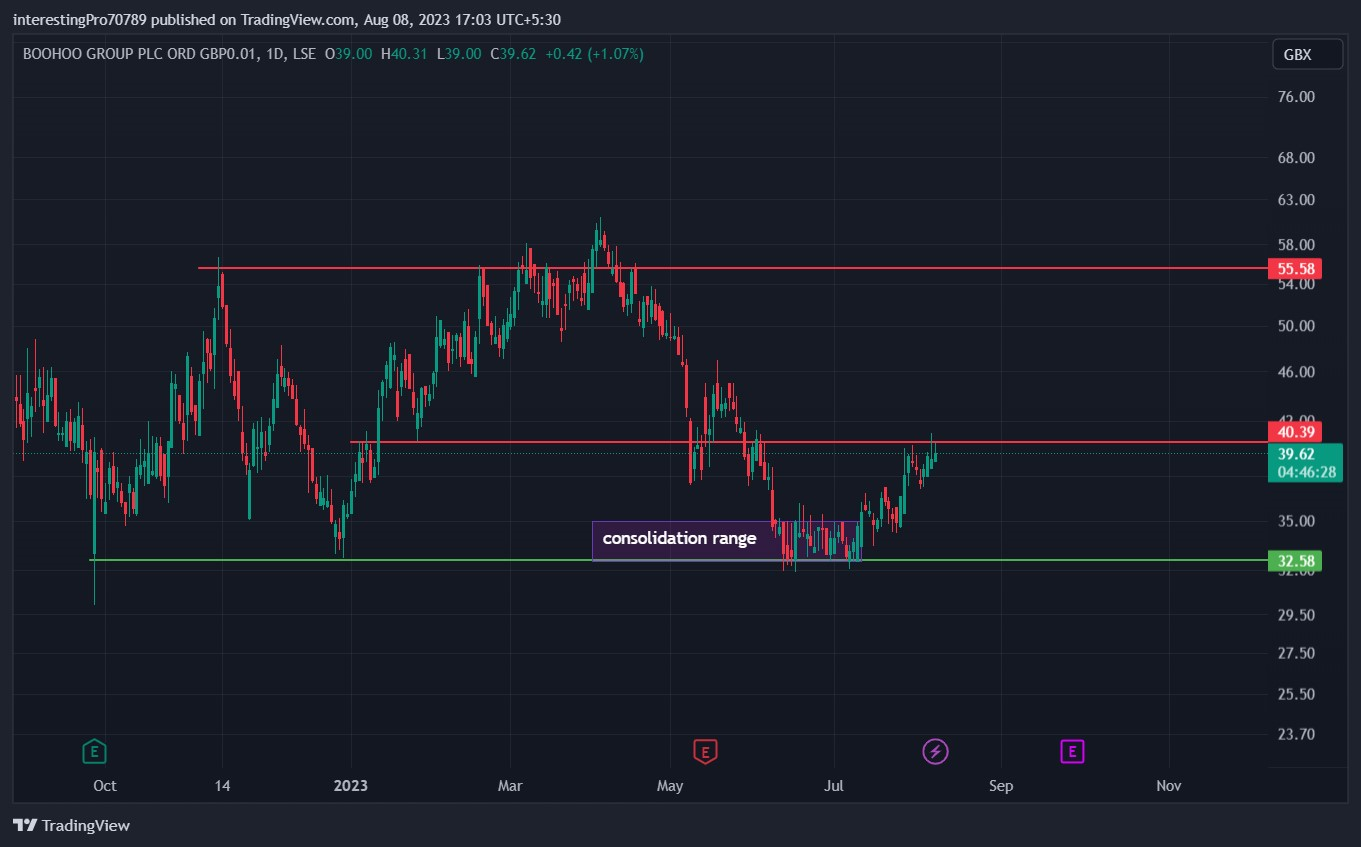
In September 2022, BOOHOO’s stock price formed a significant support level at $32.58, which initiated a bullish rally to reach $55.58. However, this level proved to be a strong resistance, causing subsequent price drops back to $32.58, followed by unsuccessful attempts to break above $55.58.
In March 2023, BOOHOO managed to breach the $55.58 resistance, but this breakout turned into a failure as heavy rejection ensued, leading the price to retreat back to its support level of $32.58. This created a higher low structure. Subsequently, the price traded within a range of $32.58 to $35.00.
July 2023 saw BOOHOO’s price break out of this range, rallying to $40.39 resistance and signaling a robust bullish reversal. Presently, the price is trading below the $40.39 resistance, attempting to break out once again. If it succeeds in breaking above $40.39 with substantial trading volume and sustains this level, the price is likely to target the next resistance at $55.58. However, if the breakout at $40.39 is not successful and leads to rejection, the price could revert back to the $32.58 support level.
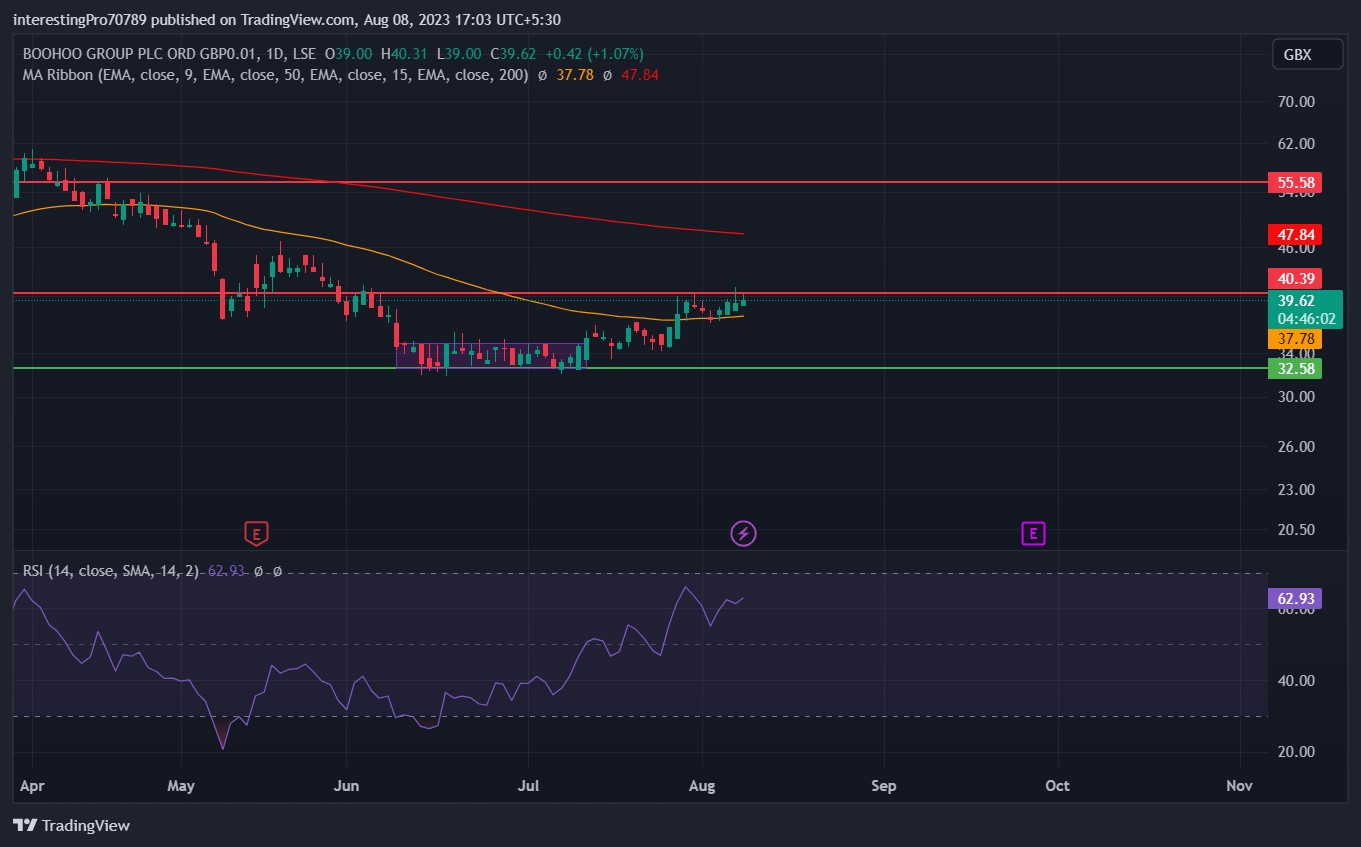
The relative strength index (RSI) is at 62.93 which indicates the bullish sentiment and buyer dominance in the BOOHOO chart. The upward movement of the RSI line suggests increasing strength among buyers. However, with the RSI heading towards the overbought territory, a potential pullback in the short term could be anticipated.
The 50 EMA (yellow line) is at $37.78 and the 200 EMA (red line) is at $47.83. Both EMA lines are presently exhibiting a sideways trend, and the price is trading within this range. This suggests a period of uncertainty and indecision in the market.
Conclusion
The overall chart pattern of BOOHOO indicates a bullish sentiment. The recent price action has displayed signs of a bullish reversal from the $32.58 support level. Presently, the stock is trading below its immediate resistance at $40.39.
If the price successfully breaks above the $40.39 resistance and maintains its position above this level, it could trigger a bullish rally that might lead the price towards the next resistance at $55.58. Conversely, in the event of a rejection from the $40.39 resistance, there is a possibility that the price may revisit the $32.58 support level once again.
Technical levels
Resistance levels: $40.39 and $55.58.
Support levels: $32.58.
Disclaimer
The views and opinions stated by the author, or any people named in this article, are for informational purposes only. They do not establish financial, investment, or other advice. Investing in or trading crypto assets comes with a risk of financial loss.




