
 Minter
 Quack AI
 NEAR Protocol
 Sui
Sui Hyperliquid
 Cardano
 Raydium
- KOD stock price surged 1.89% in the last trading session and is currently trading at $3.23.
- Kodiak Sciences’ share price (NYSE: KOD) declined nearly 60% in the last 21 days and currently forming a double bottom pattern on the daily timeframe.
Kodiak Sciences (NYSE: KOD) is a company that develops new treatments for eye diseases that can cause blindness. It uses a special technology called ABC that can deliver drugs to the eye for longer than other medicines.
Kodiak Sciences’ share price currently trades at $3.23, gaining 1.89% in the last trading session. KOD stock holds a market cap of $169.07 Million. It has a total of 52.34 K shares outstanding. The PE ratio for the stock is negative.
KOD Stock Price Prediction Using Price Action Strategy
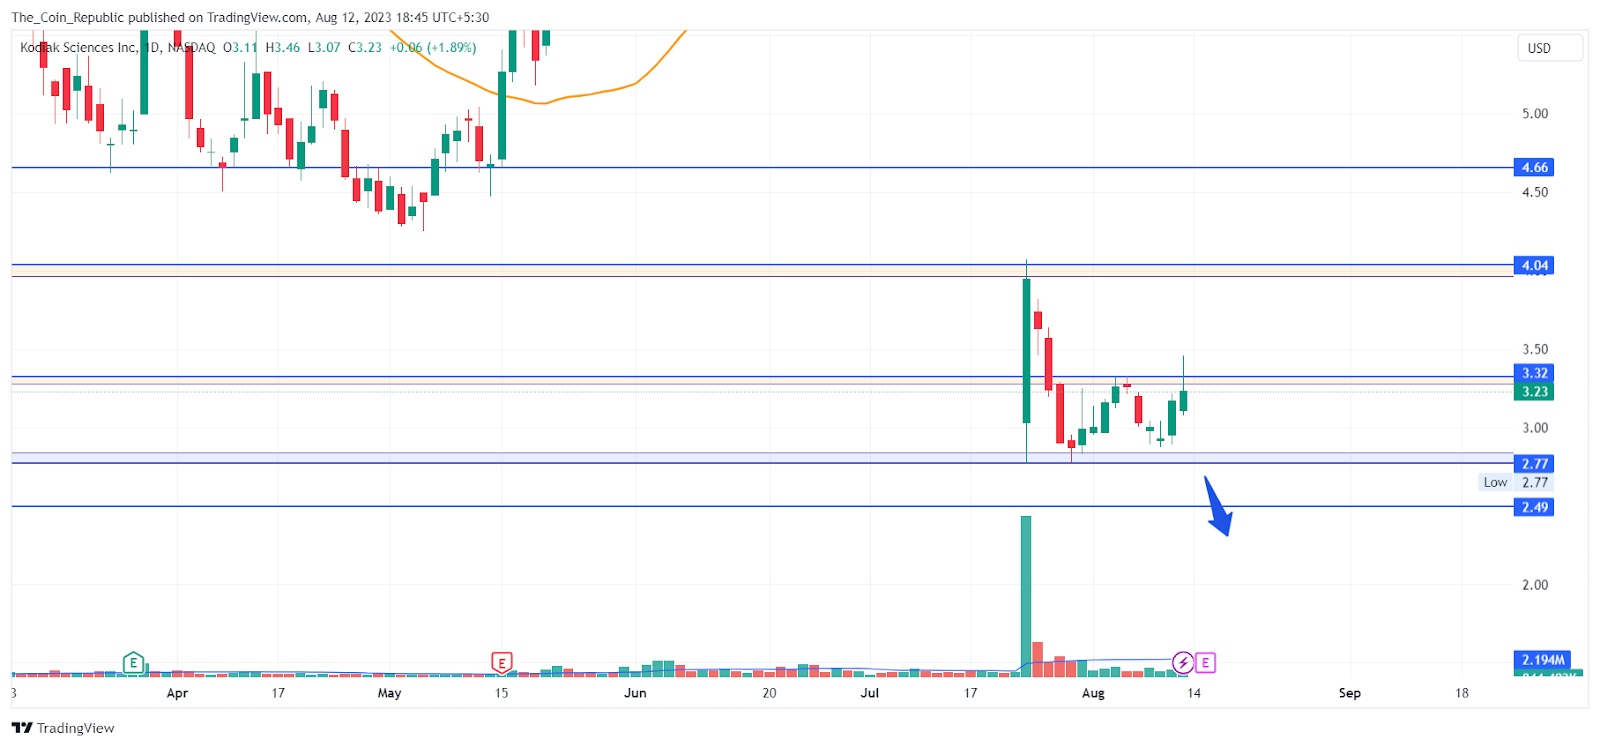
KOD share price analysis reveals that the stock price has been in a strong declining trend for the past 6 months wiping out 60% of its value in the past 6 months and and 30.8% in the last 3 months.
Recently, the price opened a gap of nearly 60%, and currently trying to sustain at the current level.
The short-term outlook for the stock indicates that the price may decline further if breaks below the current low. Analysts warn investors to stay out of such stocks as the stock has been a game of pump and dump now.
The long-term trend outlook for the stock is a strong declining trend as the stock is trading below 200 EMA.
KOD Share Price Forecast from Indicators’ point of view
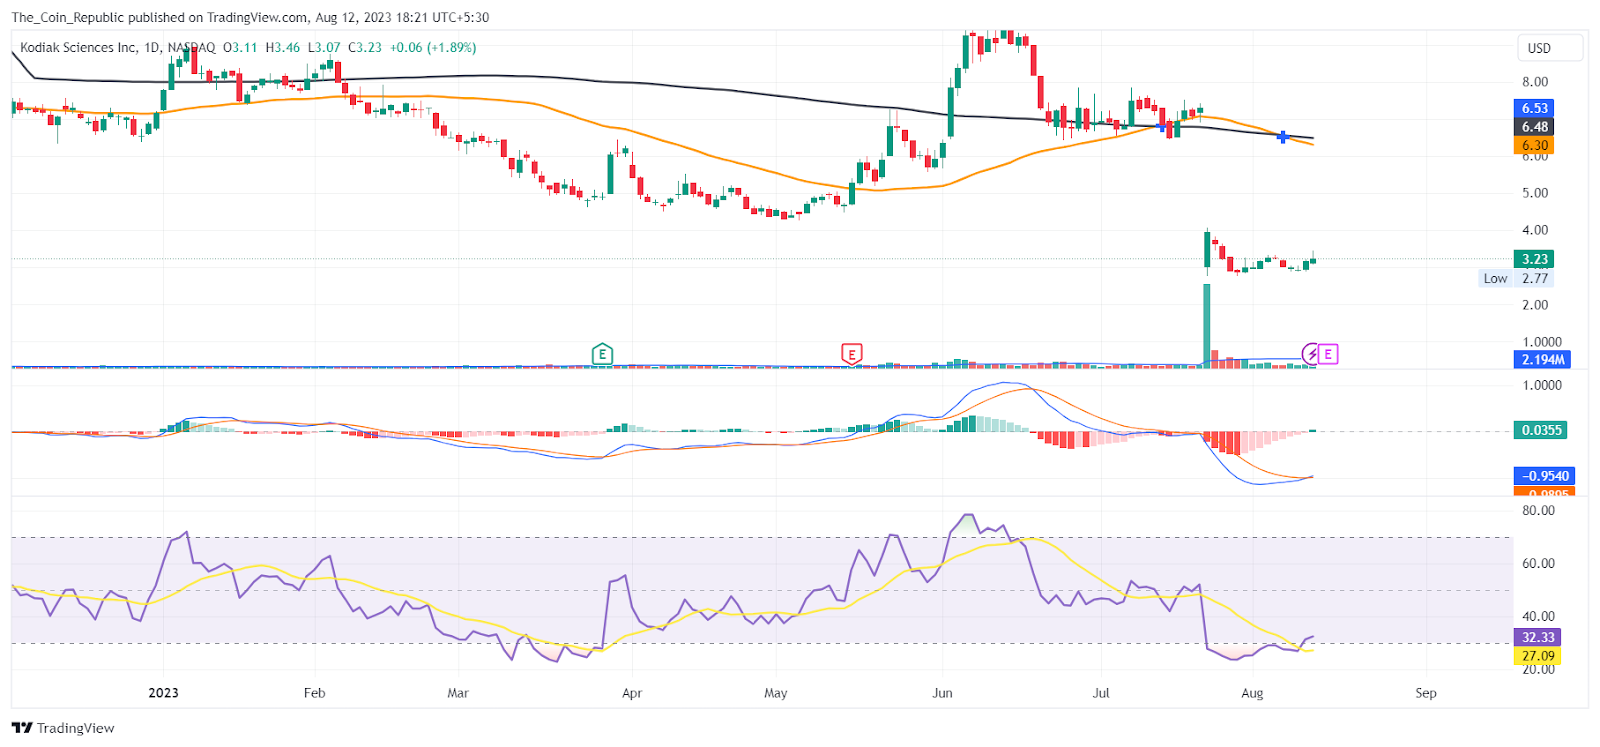
As per the EMA analysis, the KOD stock price is trading below 50 and 200 EMA both which indicates the price to be in a strong declination phase in both the short-term and long-term.
At the time of publishing, the RSI value of the KOD share price is 32.33 and that of the SMA line is 27.09. RSI is declining which indicates a short-term bearishness in the market.
MACD lines have made a bearish crossover and the histogram bars are increasing in height which indicates the continuation of the bearish sentiment in the short-term.
Conclusion
KOD stock price prediction concludes that the price has been falling sharply for six months, losing 60% of its value. The price gapped down 60% recently and is struggling to hold. The short-term outlook is bearish and analysts advise investors to avoid the stock. The long-term trend is also negative as the price is below 200 EMA.
Technical Levels
- Support levels: $2.77 and $2.49.
- Resistance levels: $4.04 and $4.66.
Disclaimer
The views and opinions stated by the author, or any people named in this article, are for informational purposes only and do not establish financial, investment, or other advice. Investing in or trading crypto or stock comes with a risk of financial loss.




