
 Quack AI
 NEAR Protocol
 Monero
 Lighter
 Ethena
 Pons
Pons Sui
Sui
- Pepe’s price (PEPE) slid 8.06% in the last 24 hours and is currently trading at $0.000001105.
- PEPE price is trying to form a bullish flag pattern on the daily chart.
Pepe (PEPE) is a meme coin that pays tribute to Pepe the Frog, a character with a long and controversial history. The project stands out from other cryptocurrencies by honoring this character’s legacy and attracting crypto enthusiasts.
The Pepe token is currently trading at $0.000001105 with a decline of 8.06% in the last 24 hours. PEPE holds a total market cap of $432.48 Million and ranks 76th in the crypto market.
PEPE token has a trading volume of $181.18 Million with an increase of 41.05% over the past 24 hours. The coin has over 391.79 Trillion tokens in circulating supply. The volume-to-market cap ratio of the PEPE token is 41.97%, indicating high volatility in the market.
Pepe Price Prediction Using Price Action Strategy
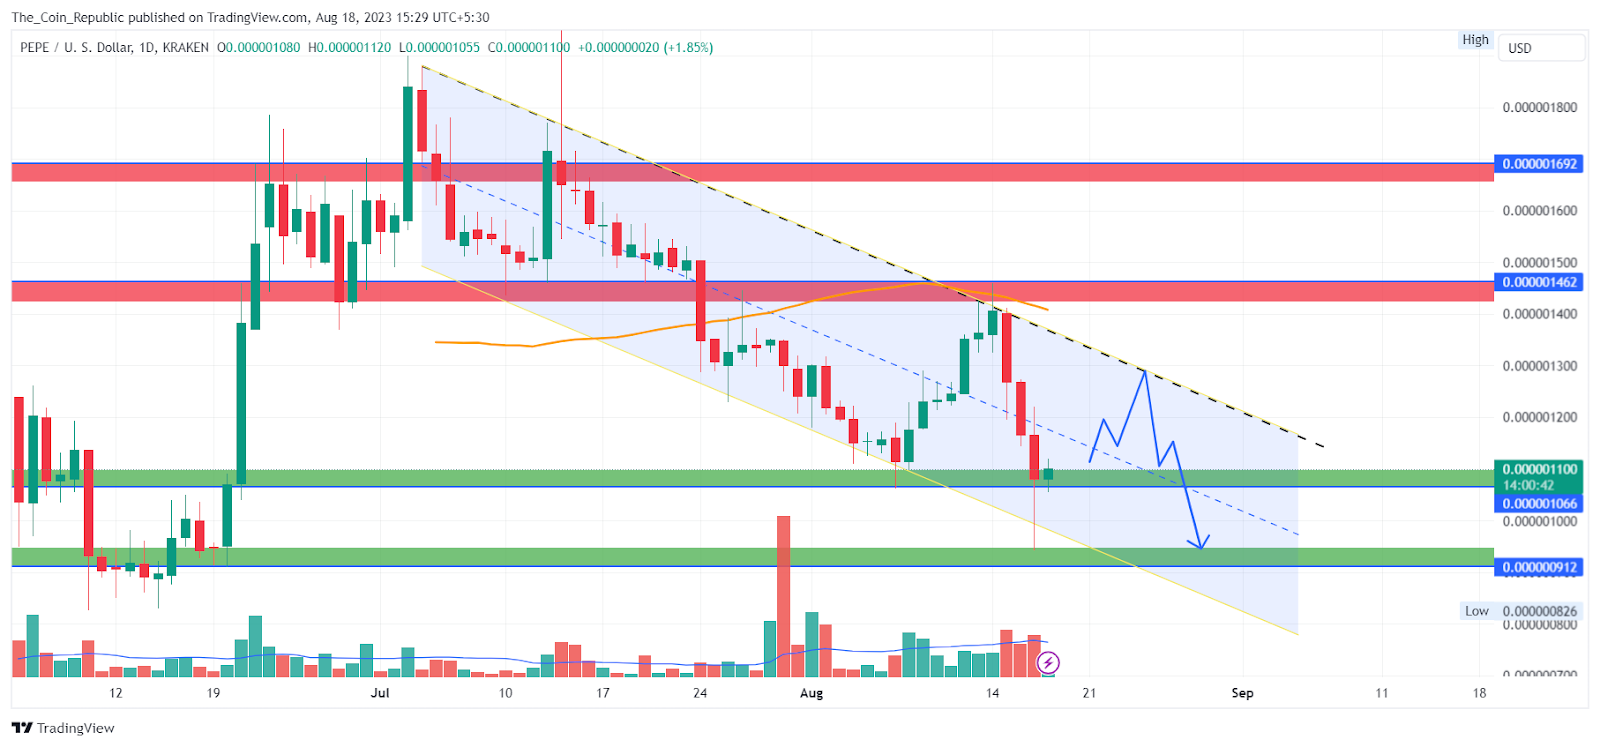
The token Pepe soared by 75% in June 2023 and escaped the consolidation phase, changing its long-term trend to an uptrend. After a pullback, the price attempted to rise higher but faced resistance from the demand zone and declined forming lower highs.
Thereafter, the price is showing a declining trend and trading in a range and forms a parallel channel pattern i.e. bullish flag pattern. The price seems to have undergone a correction phase after a hike.
Recently, the price took a rebound from the demand zone but suffered rejection from the upper trendline of the channel and declined indicating that the price has not got sufficient buyers to break above the channel.
The short-term outlook for the trend is bearish until the price maintains itself in the channel and the price may correct more forming lower highs. The breakout of the channel may invite the buyers to enter the market and take control.
PEPE Price Forecast from Indicators’ point of view
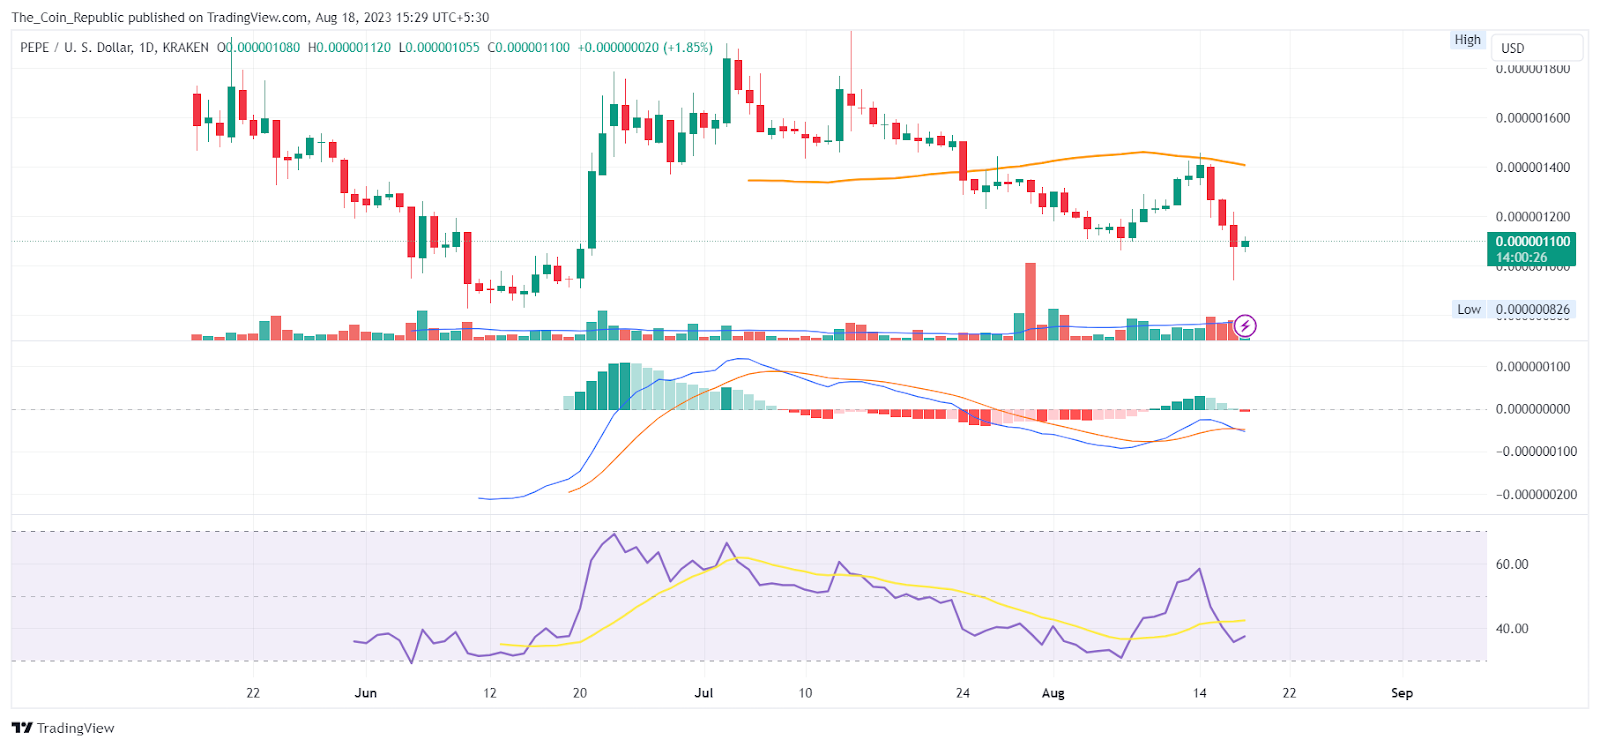
As per the EMA analysis, the PEPE price suffered rejection from the 50 EMA indicating the presence of the sellers in the market in the short term.
At the time of publishing, the RSI value of the PEPE token is 37.92 and that of the SMA line is 41.68. RSI is declining, suffering rejection from the SMA line signaling the presence of sellers in the market.
MACD lines have made a bearish crossover. Furthermore, Histogram bars are being formed below the mean line. Which indicates the resumption of the correction in the price in the short term.
Conclusion
Pepe price prediction shows that the price token price hiked by 75% in June 2023 and entered an uptrend. It then pulled back and faced resistance from the sellers, forming a bullish flag pattern. The Price is in a short-term downtrend within the channel, making lower highs. Pepe Price needs to break out of the channel to resume its uptrend, otherwise, it may correct further. Pepe Price bounced from the demand zone recently but failed to overcome the upper trendline of the channel.
Technical Levels
- Support levels: $0.000001066 and $0.0000000912.
- Resistance levels: $0.000001462 and $0.000001692.
Disclaimer
The views and opinions stated by the author, or any people named in this article, are for informational purposes only and do not establish financial, investment, or other advice. Investing in or trading crypto or stock comes with a risk of financial loss.




