
 Quack AI
 Pudgy Penguins
 Injective
 Solana
 NEAR Protocol
 Canton
 Zcash
Zcash
- The ABDN stock price is trading at 162.15.
- The company price is in the absolute control of sellers.
ABRDN Plc (LSE: ABDN) was founded in 1825. It is an investment company that deals in the provision of asset management and saving solutions. The company operates through four segments which are Investment, Advisor, Personal, and Corporate.
ABRDN Plc (ABDN) Stock: Technical Analysis
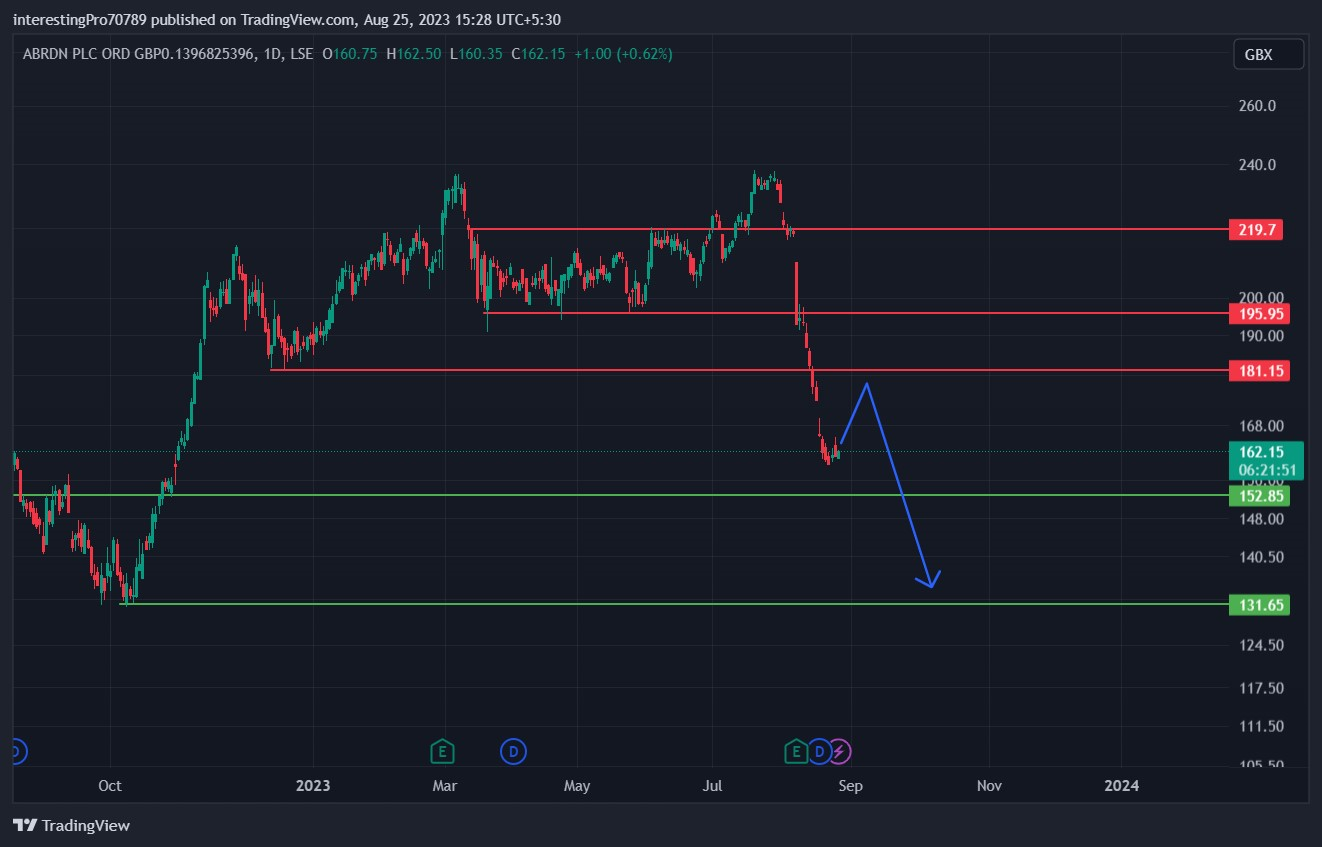
The ABRDN stock price formed a support of 181.15 GBX in December 2022 and commenced a bullish rally. After reaching 237 GBX, the price got exhausted and started to fall. The price fell to 195.95 GBX.
After reaching 195.95 GBX, the price got stuck into the narrow zone of 219.7 GBX to 195.95 GBX. It started trading inside this zone for about five months. It took pressure from the sellers at 219.7 GBX and buyers at 195.95 GBX.
The price tried to give the breakout of the zone and 219.7 GBX but faced an immediate rejection in July 2023. That turned the breakout into a fakeout. Buyers again pushed the price and gave the breakout of the 219.7 GBX resistance. This time the buyers moved the price to 237 GBX resistance. Sellers again showed their dominance and forced the price to fall.
ABRDN stock price broke all the support at the downside. It also gave the breakdown of 181.15 GBX and has shown a gap-down scenario. So, now the price can give a minor pullback to fill the gap left in the market. It can again fall to its next support at 152.85 GBX. If the seller continued their dominance, then the price can be also seen at 131.65 GBX support.
Technical Indicators’ Prediction About the Current Trend
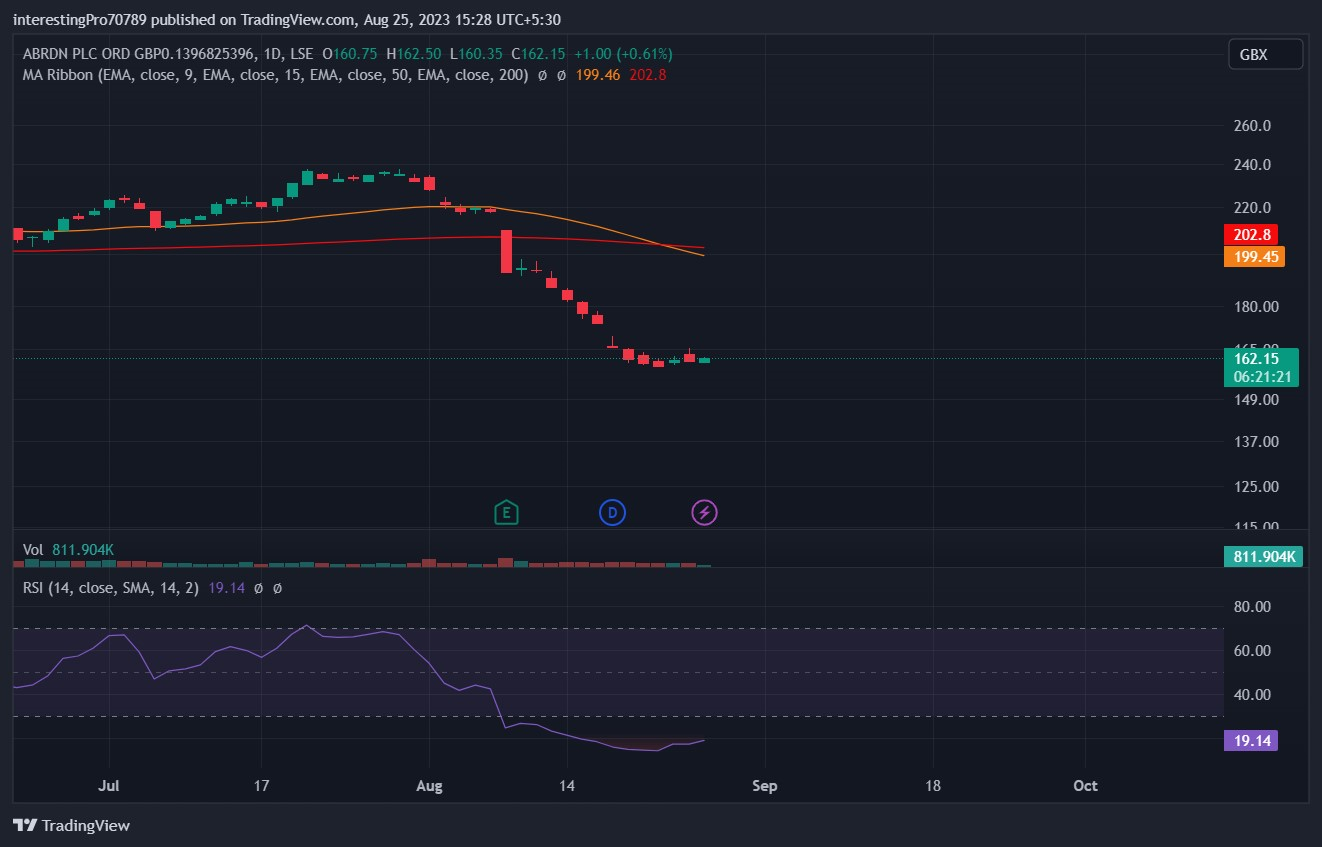
The 50-EMA (yellow line) is at 199.45 GBX and the 200-EMA (red line) is at 202.8 GBX. The price of ABDN is currently below the 50 and 200 EMA. It has created a golden crossover between 50 and 200 EMA. However, the price is trading a little far from the EMA’s. That indicates the price of ABRDN stock is bearish and can show a minor pullback shortly.
The relative strength index (RSI) is at 19.14. The RSI is at oversold territory. This indicates that the price of ABRDN stock can take a pullback shortly.
Conclusion
The ABRDN stock price is in bearish sentiment with absolute control of sellers. It has shown the signs of taking a short-term pullback with the help of indicators. If the price shows a pullback, it can be a great opportunity for sellers to place their short positions.
Technical levels
Resistance levels: 181.15 GBX.
Support levels: 152.85 GBX and 131.65 GBX.
Disclaimer
The views and opinions stated by the author, or any people named in this article, are for informational purposes only. They do not establish financial, investment, or other advice. Investing in or trading crypto assets comes with a risk of financial loss.




