
 Quack AI
 NEAR Protocol
 Zcash
Zcash Celestia
 Pons
Pons Pudgy Penguins
 Bitcoin
- Target Corp.’s (TGT) stock price is below the 50 EMA and 100 EMA levels.
- TGT stock price is $121.79.
- Target Corp. (NYSE: TGT) has a live market cap of $60 Billion.
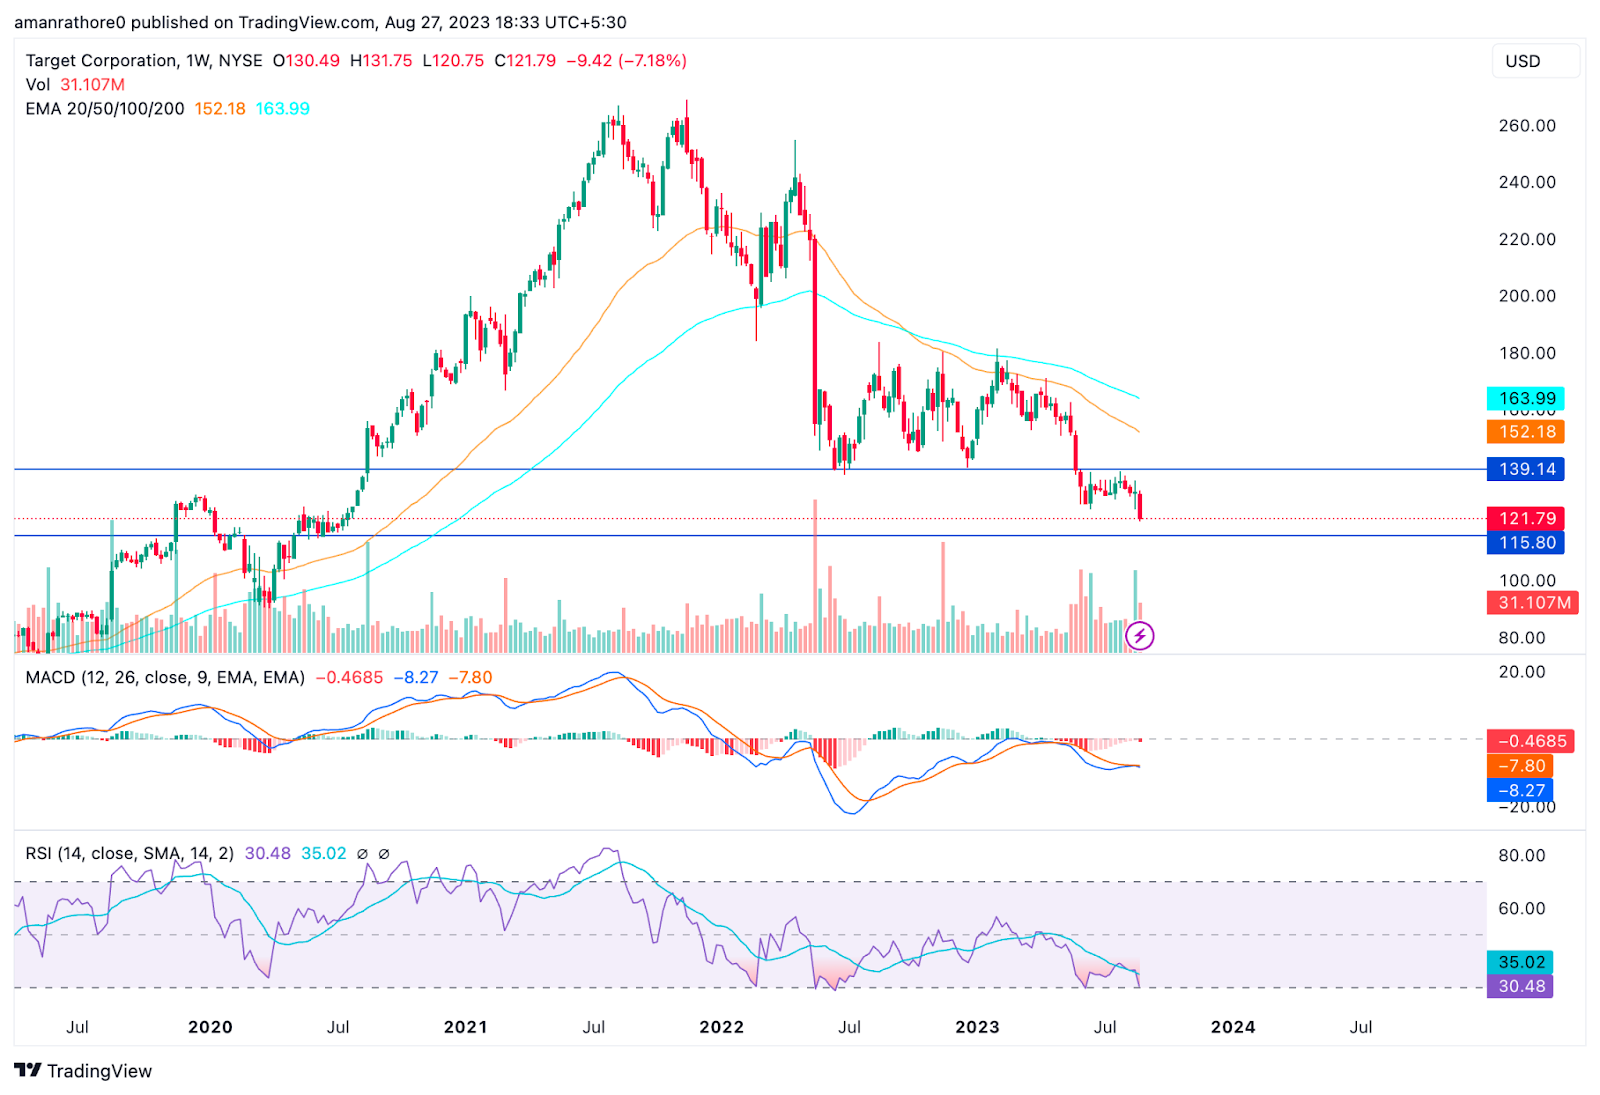
The share price of Target Corp. (NYSE: TGT) is trading in a downtrend. The price of TGT is making new lower lows in the weekly time frame.
The revenue of Target Corp.’s stock is $108.01 Billion and has a market cap of $56.2 Billion. The stock’s beta value is 1.01. The Target (TGT) has a 52-week high of $183.8 and a 52-week low of $125.0.
The revenue of Target Corp. stock has decreased for the last 2 quarters in 2023. The revenue declined from $31.3 Billion to $25.3 Billion, with an average fall of 19.3% per quarter.
Target Corp.’s (TGT) stock price made a high of $267.07 on 7 August 2021, and since then, the price has been in a downtrend. The price has shown a decline of 54.25% since June 2023.
Currently, the TGT stock price is moving in a narrow range of $137.4 to $123.8. The TGT stock’s overall structure is bearish and the price may break the support and form a new swing low.
Since last year, the value of Target Corp. (TGT) stock fell by 23.33%. This indicates that the TGT stock is showing a bearish momentum and the price is likely to fall.
Target Corp. (TGT) Stock Price Analysis
EMA
Target Corp.’s stock price is trading below the 50-day and 100-day EMA levels. This shows that the TGT stock is in a bearish trend and a further fall in stock price is possible in the future.
MACD
The MACD line for the Target stock (NYSE: TGT) is trading below the signal line. There is also a red histogram build-up in the TGT stock. This indicates that the TGT stock is currently bearish and the prices may decrease in the next few days.
RSI
The 14-day SMA line and the RSI line of the Target (TGT) stock are close to the 30 level. The weak RSI line for Target (TGT) stock indicates that the price will decrease in the future.
Conclusion
As per the analysis, the price of Target Corp. stock is decreasing. This trend is likely to continue in the short term. The indicators are also giving a bearish signal. As a result, it is indicated that the TGT stock price will fall in the upcoming days.
Technical Levels
- Support Level: $115
- Resistance Level: $139
Disclaimer
The views and opinions of the author, or anyone named in this article, are for informational purposes only. They do not offer financial, investment, or other advice. Investing or trading crypto assets involves the risk of financial loss.




