
 Minter
 Pearl
Pearl NEAR Protocol
 Pons
Pons Quack AI
 Quantus
 Sui
Sui
- The GHE stock price is trading at 1060 GBX.
- The company stock has given a breakout of the 1010 GBX resistance. It is currently sustaining above it.
Gresham House Plc (LSE: GHE) was founded on 14 May 1857. The company provides funds, direct investment, and tailored investment solutions.
Gresham House Plc (GHE) Stock: Financial Analysis
The GHE company has been consistently growing. Its revenue increased significantly over the years. The company has shown 0.90% growth in profit over the past three years.
The company’s earnings per share EPS has also grown consistently. It suggests that the company’s profitability has also increased over the past three years.
Besides, the firm has been paying good dividends to its shareholders.
Gresham House Plc (GHE) Stock: Technical Analysis
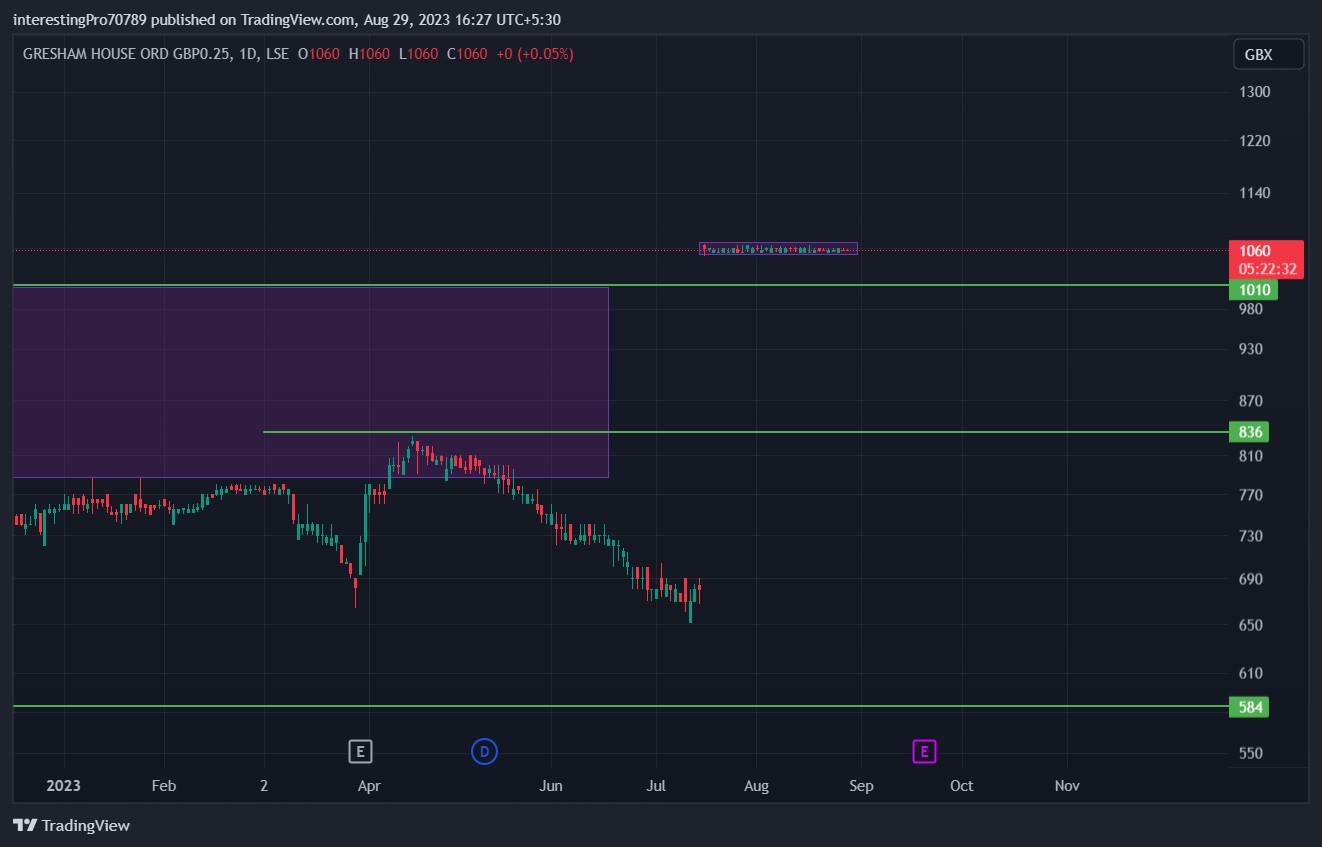
The GHE stock price started a bullish rally of 450 GBX to 960 GBX in 2020. After that, the price remained in an accumulation phase. The stock started trading in a wide range of 1010 GBX (resistance) and 788 GBX (support).
The price gave the breakdown of the range in September 2022 with a small selling phase.
The GHE Stock Price has recently opened above the 1010 GBX resistance with 350 points and a gap up. The price is currently trading inside a narrow range of 1070 GBX (resistance) to 1050 GBX (support). It is sustaining above the 1010 GBX resistance.
Since the stock value is sustaining above the 1010 GBX resistance, it is acting as a support now. The buyers may maintain to sustain over the 1010 GBX and give the breakout of the narrow range. A bullish move may occur in the price if that happens!
Suppose the price breaks below the 1010 GBX level, it may fall to the 836 GBX level. That level will act as support. However, the price must close below the recent high of 836 GBX to continue the downtrend. If that does not happen, it will considered a pullback. The price may rise again from there.
Technical Indicators’ Prediction About the Current Trend
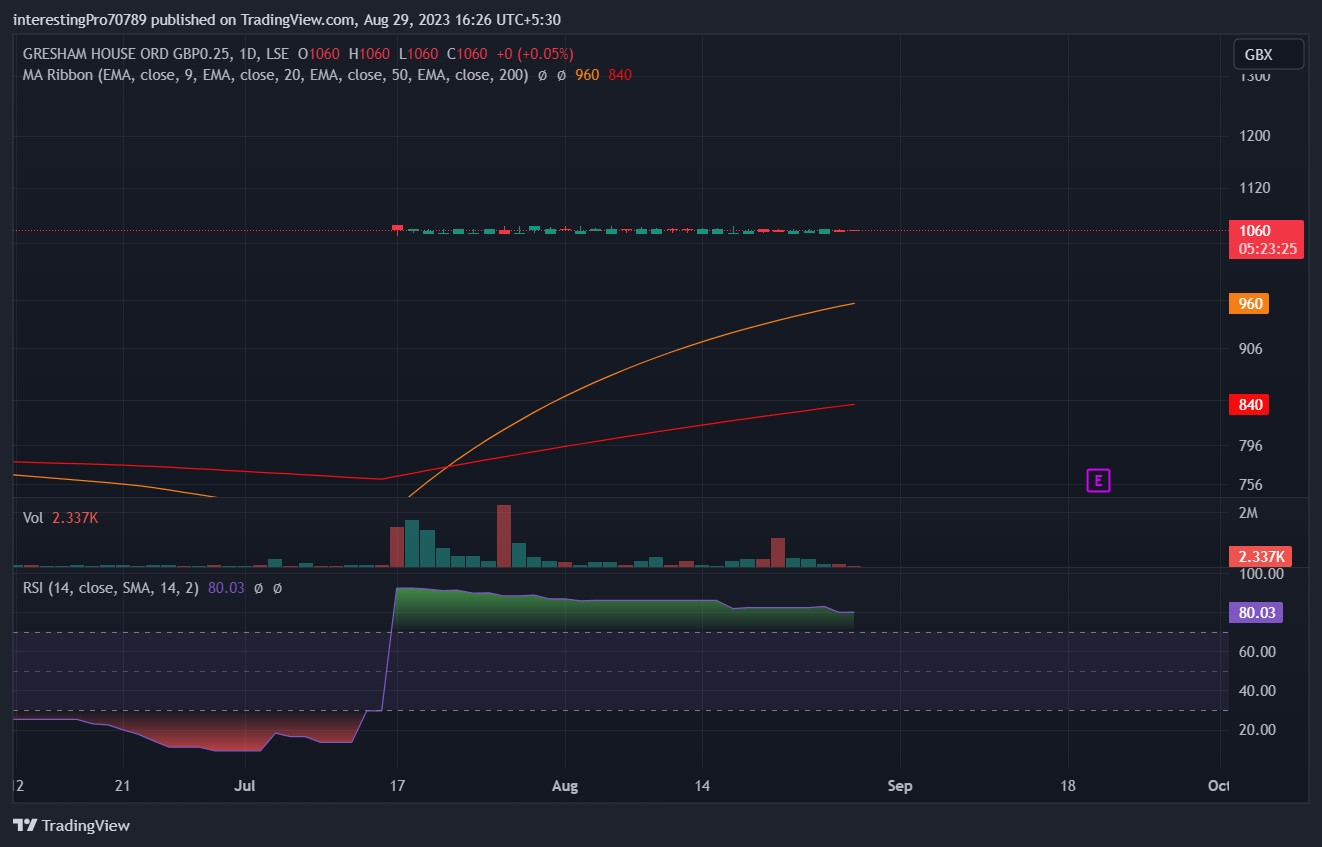
The 50 exponential moving average (yellow line) is at GBX and the 200 exponential moving average (red line) is at GBX. The GHE stock price is trading above 50 and 200 EMA. It indicates that the price is in bullish sentiment and under the control of buyers.
The relative strength index is at. The RSI is in over-bought territory indicating the price is due for a pullback in the future.
Conclusion
The Gresham stock is bullish. The price is trading in a small range. The breakout or breakdown of that range will decide the future trend. All the indicators mentioned above for the trend analysis of Gresham House are bullish. Only RSI is in overbought territory, indicating that the price is due for a pullback.
Technical levels
Resistance levels: 1070 GBX.
Support levels: 1010 GBX and 836 GBX.
Disclaimer
The views and opinions stated by the author, or any people named in this article, are for informational purposes only. They do not establish financial, investment, or other advice. Investing in or trading crypto assets comes with a risk of financial loss.




