
 Minter
 Quack AI
 NEAR Protocol
 Pearl
Pearl Monero
 Pons
Pons Sui
Sui
- EVR stock price is currently trading at GBX 81.00 GBX.
- The company stock is showing signs of a rise in price in the future.
EVRAZ Plc (LSE: EVR) was founded in 1992 by Alexander Abramov. It is a steel manufacturing and mining firm that produces and distributes products like Steel, Vanadium, and Coal. The company operates through various operations which are Steel, Steel North America, Coal, and Other Operations.
EVRAZ PLC (EVR) Stock: Financial Analysis
In 2020, EVRAZ’s revenue fell by 0.20% compared to its previous year. The company somehow managed to improve its performance in 2021, with a growth of 0.46% in its revenue. However, the company’s financial report was not reported as the company was significantly impacted by the Ukraine war.
The company’s estimated revenue for 2023 is expected to be 13.32 Billion GBP. Th
The firm paid a good dividend consistently over the years from 2017 to 2021.
EVRAZ PLC (EVR) Stock: Financial Analysis
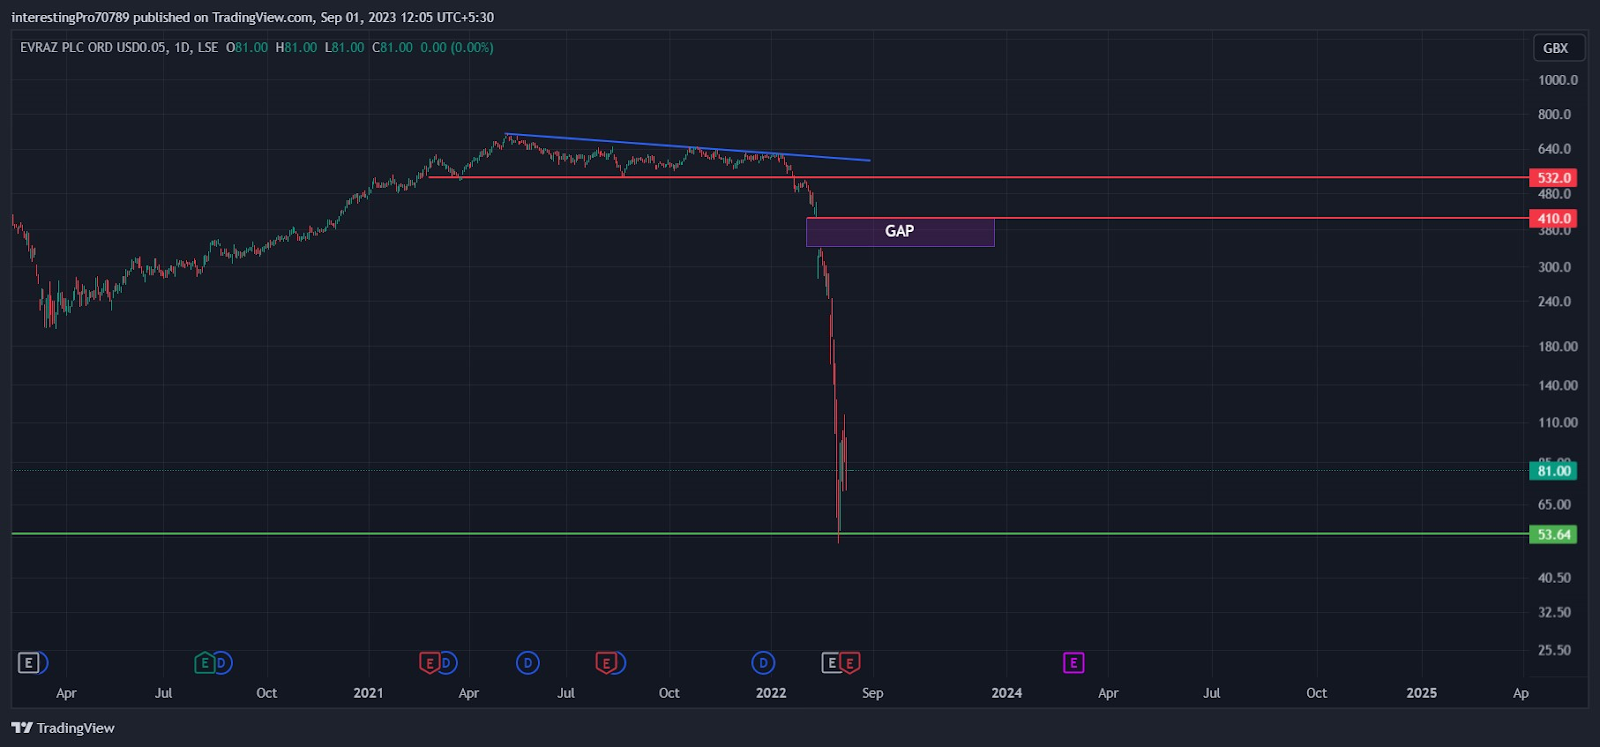
In the year 2021 and the start of the 2022 year, the price of the EVRAZ Plc Stock was seen trading inside the descending triangle pattern with a major support level of 532 GBX.
At the start of 2022, the price gave the breakdown of the descending triangle pattern and the 532 GBX support and started to fall. The price was seen falling after a minor retest from the 532 GBX support. The price also left a gap before it started to fall.
The EVR Stock price did a fall of almost 90% and was seen taking support from its historical support level at 53.64 GBX. Currently, the price is trading at 81.00 GBX. Till the price sustains above its 53.64 GBX historical support, the price could be seen rising slowly and steadily and could fill the gap at 410 GBX which was left.
However, if the price breaks below the 53.64 GBX support then the price could be see falling and continuing its downtrend to 30 GBX.
Technical Indicators’ Prediction About the Current Trend
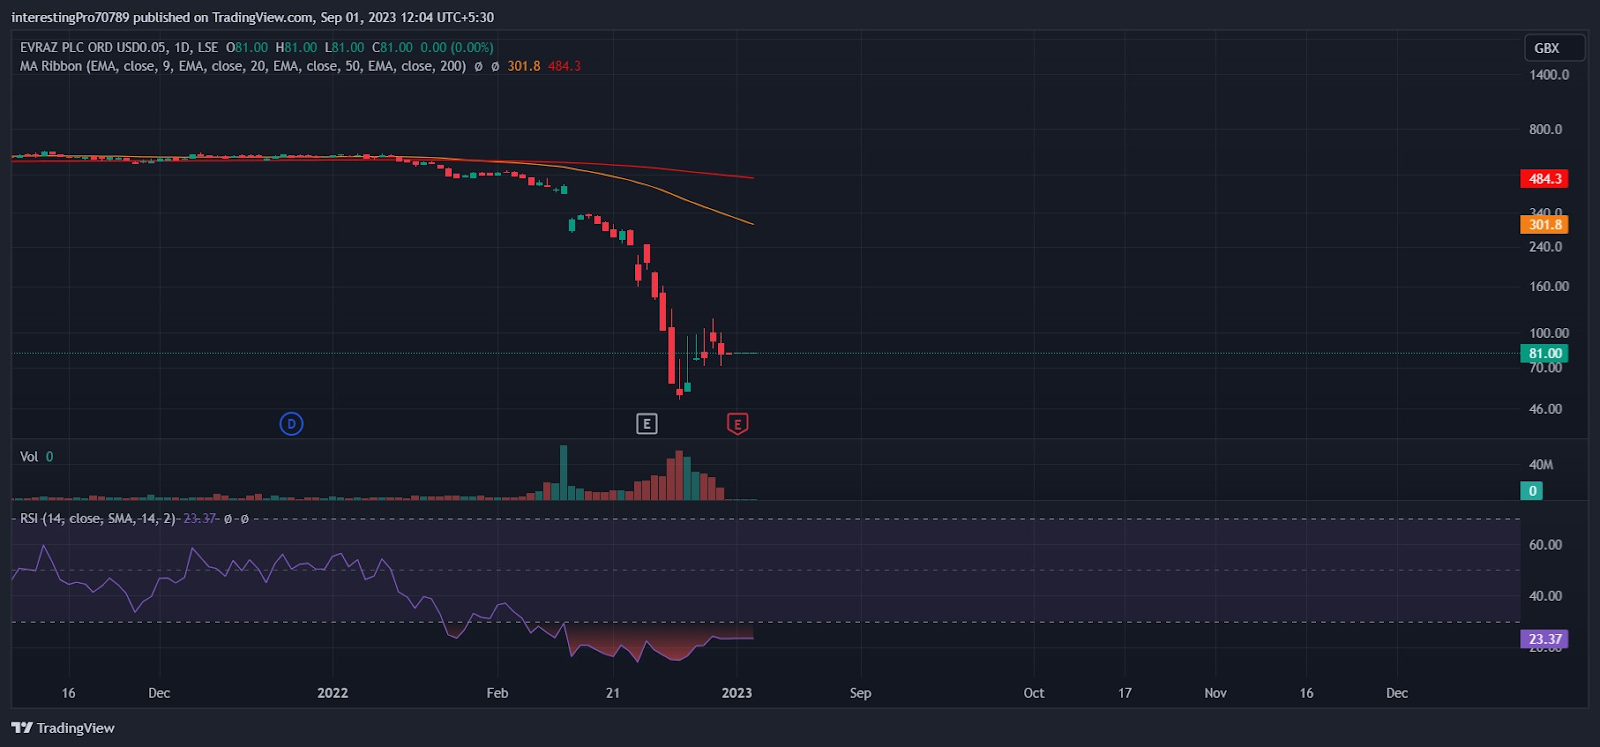
The 50-EMA (yellow line) is at 301.8 GBX and the 200-EMA (red line) is at 484.3 GBX in the EVR daily timeframe chart. The price of EVRAZ is currently trading below the 50 and 200 EMA but the price is also very far from both the EMA’s. This indicates that the price is in bearish sentiment but the price could seen going upwards to take resistance from the EMA’s.
The relative strength index is at 23.37. The RSI is in oversold territory indicating the price of EVR stock is due for a pullback and can be seen rising from this point.
Conclusion
The overall chart of the EVRAZ Plc Stock is bearish. The price has taken support from its historical support at 53.64 GBX and is sustaining above it. All the indicators mentioned above for the analysis of the EVRAZ stock price are bearish at the time of writing but they are showing signs of a rise in price in the future.
Technical levels
Resistance levels: 410 GBX.
Support levels: 53.64 GBX and 30 GBX.
Disclaimer
The views and opinions stated by the author, or any people named in this article, are for informational purposes only. They do not establish financial, investment, or other advice. Investing in or trading crypto assets comes with a risk of financial loss.




