
 Quack AI
 NEAR Protocol
 Lighter
 Bitway
 Pearl
Pearl Quantus
 Sui
Sui
- The VMID price is trading at 28.800 GBX.
- The price has formed a descending triangle pattern and is currently trading inside the pattern.
The VMID Exchange Traded Fund (ETF) is offered by Vanguard. It was designed to follow the FTSE-250 index. By purchasing the VMID ETF which offers physical exposure, you can get a portion of each of the 249 underlying holdings. By paying dividends, this ETF creates a source of income.
Vanguard Funds Plc (VMID) ETF: Technical Analysis
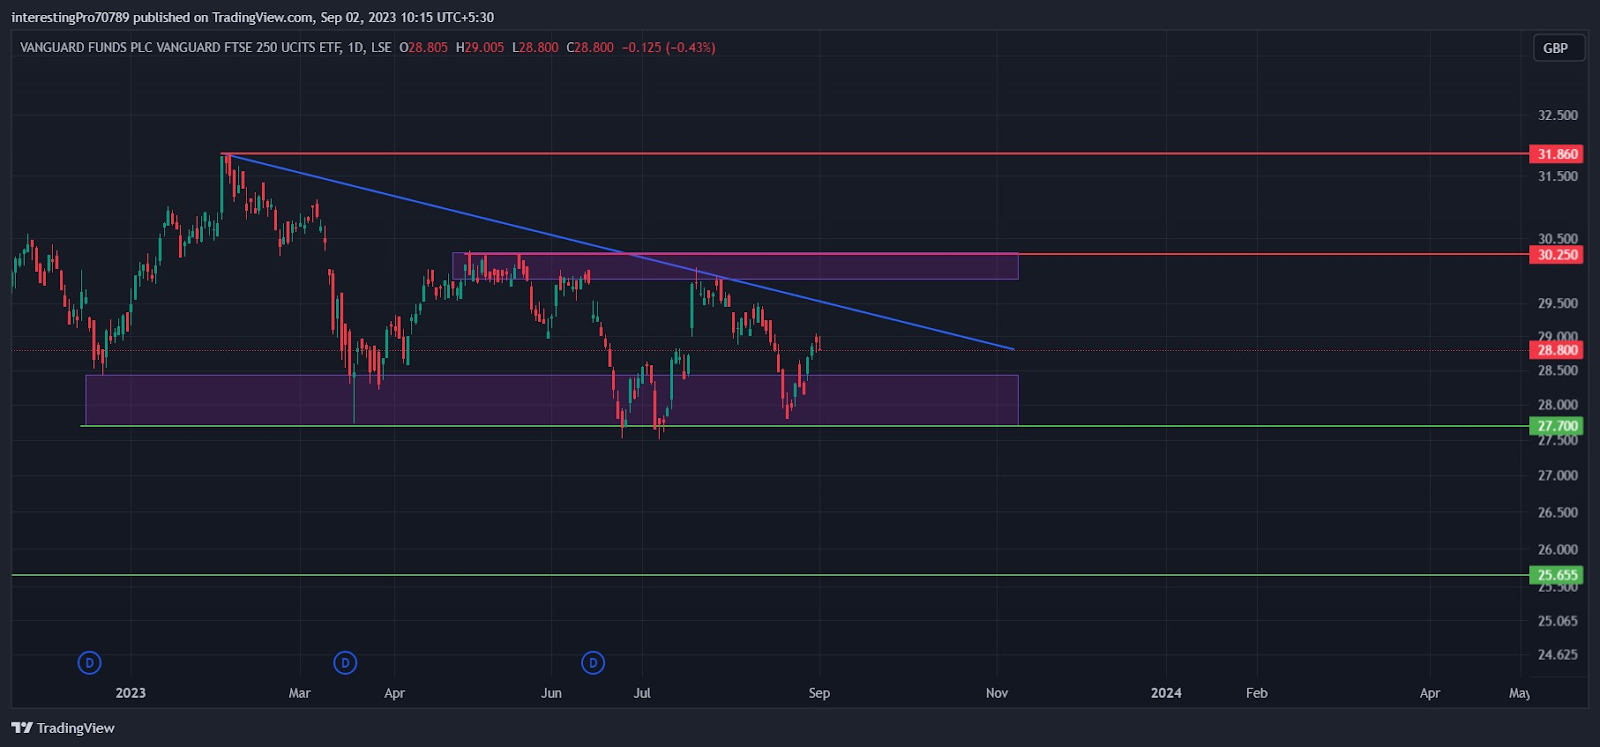
The VMID ETF is currently trading at 28.800 GBX with an average volume of 66.58K.
In December 2022, the VMID price formed support at the 27.700 GBX support zone and commenced a bullish rally. The price was seen rising to 31.860 GBX and after reaching there the price faced rejection and was seen falling from there. The price fell back to its 27.700 GBX support zone.
In March 2023, the price again commenced a bullish rally from the support zone but the buyers couldn’t raise the price as they did previously. The price went up to the 30.250 GBX level and was facing rejection from there. The price was again falling to its 27.700 GBX support zone.
The buyers again tried to push the price by giving a breakout of the double-bottom pattern. This time the price faced rejection from the trendline which was coming from above and the price went back to its support zone.
Currently, the price has again shown a bullish sentiment from the support and is just below the trendline. If the price gives the breakout of the trendline and the 30.250 GBX resistance zone. Then the price could be seen rising to 31.860 GBX resistance.
However, the price has made a descending triangle which is a bearish pattern. So if the price gives the breakdown of the 27.700 GBX support. The price could be seen falling to 25.655 GBX. Which will act as the next support for the price.
Technical Indicators’ Prediction About the Current Trend
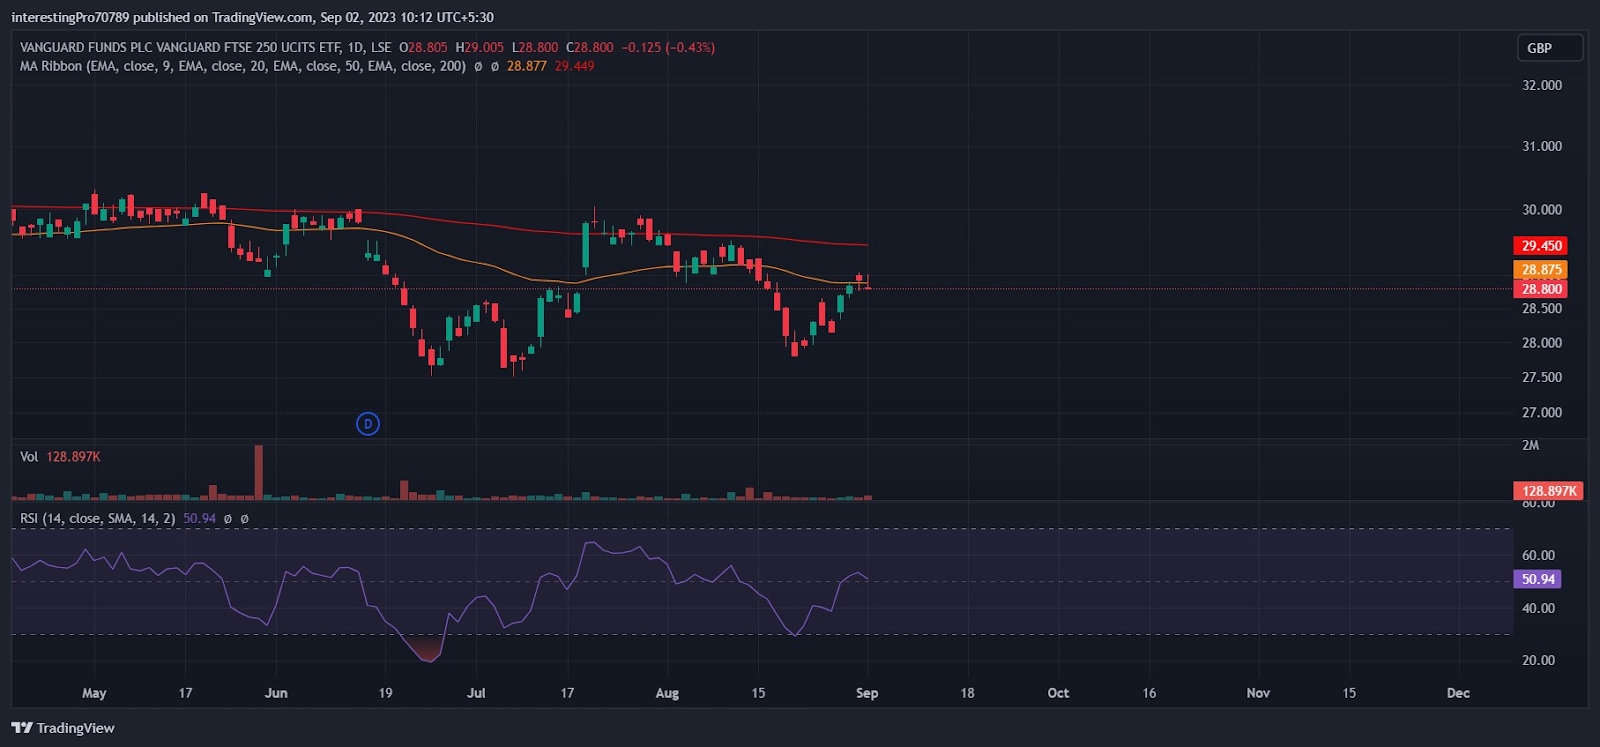
The 50-ema line (yellow line) is at 28.875 GBX and the 200-ema line (red line) is at 29.450 GBX. The price has currently faced resistance from the 50-ema line and it is also trading below the 50-ema and 200-ema. This indicates the price is in bearish sentiment at the time of writing.
The relative strength index is at 50.94. The RSI line is in neutral territory indicating price is currently being pressurized by the buyers as well as sellers.
Conclusion
The VMID price is in bearish sentiment as the sellers are shifting to each recent high made by the price. The price has also made a descending triangle pattern which is a bearish pattern. So if the price gives the breakdown of the 27.700 GBX support. Then the price could be seen falling to its next resistance given above. However for the price to be in bullish sentiment it must have to give the breakout of the 30.250 GBX resistance then only the price could be seen rising in the upward direction.
Technical levels
Resistance levels: 30.250 GBX and 31.860 GBX.
Support levels: 27.700 GBX and 25.655 GBX.
Disclaimer
The views and opinions stated by the author, or any people named in this article, are for informational purposes only. They do not establish financial, investment, or other advice. Investing in or trading crypto assets comes with a risk of financial loss.




