
 Minter
 Bittensor
 Quack AI
 NEAR Protocol
 Pons
Pons Pearl
Pearl Bitcoin
- RTO stock is hovering near its all-time high and investors are confident.
- The company has been reporting consistent revenue and has also been backing up net profit over the years.
- The price has bounced off its 200 EMA after some correction.
RTO is a listed company on the London Stock Exchange that manufactures products and services that protect people from pest-borne diseases and from the risks of poor hygiene. It is considered one of the global leaders in Pest Control. The company was founded in 1924 and it currently has more than 58 thousand employees.
Financial Analysis of Rentokil Plc
We start our financial analysis of Rentokil with the company’s income statement. The most important thing to note is the firm’s consistent revenue growth. The company’s revenue was £2.17 Billion in 2016 which has grown to £3.71 Billion as per the last year’s annual report. This reflects a compounded annual growth rate of 11.16%, which is more than twice the industry growth rate of 5.7% CAGR.
Considering the capital-intensive nature of the business, the firm is left with a gross profit of £977 Million in 2022, and over the years the gross margin has been maintained at an average of 23%. After taking into account the operating expenses of £479 Million, the company is left with an Earnings before interest and taxes (EBIT) margin of 13%.
After paying taxes the company is left with an After-tax profit of £232 Million, which is around 6% of the revenue. It RTO is notable that the firm has been net profit positive all the time except in 2018 where there was an unexpected loss of £18 Million.
With a positive net profit comes positive profitability ratios. The return on equity is 8.6% while the return on the invested capital is 4.3%. Furthermore, the company has been paying attractive dividends since the beginning. With an average dividend payout ratio of 54% over the years, Rentokil has been giving a dividend yield of 1.5% on average.
Balance Sheet and Cash Flow Statement
In the company’s balance sheet, there’s a noticeable trend of consistent increases in its net property, plant, and equipment, which has grown from £416 million in 2016 to £625 million in 2022. Additionally, in the short-term assets section, Rentokil has significantly increased its cash and short-term investments. As the saying goes, a cash-rich balance sheet can address many of a company’s challenges, and it appears that Rentokil’s management is adhering to this principle.
On the liabilities side, the long-term debt has garnered attention. While the company does have a relatively high level of debt, it’s important to consider that Rentokil operates in a capital-intensive industry, and such debt levels are not uncommon. Furthermore, the debt-to-equity ratio stands at just 0.45, indicating that the company has ample reserves and cash to manage its debt even in adverse scenarios.
Turning to the cash flow statement, a critical concern for any company is maintaining a balance between its cash flow from operations and its Earnings Before Interest, Taxes, Depreciation, and Amortization (EBITDA). This equilibrium often hinges on timely payments from creditors. Rentokil has managed to maintain this balance by keeping changes in working capital to a minimum. In 2022, the CFO (Cash Flow from Operations) amounted to £606 million, closely aligning with its EBITDA of £607 million after accounting for certain non-cash items.
In terms of investing activities, the company consistently allocates resources for acquiring assets and for making investments in businesses. The total cash spent on investments in 2022 exceeded £1.2 billion, resulting in a net cash outflow of £1.9 billion for the year.
What does the financial analysis show?
After the analysis of the 3 major statements, It is safe to assume that the firm is focused on being profitable. The company balances its profits and cash very efficiently while setting out a firm dividend payout ratio to attract investors. The remaining funds are being reinvested into the business, and the results are clearly reflected in the company’s revenue figures. Rentokil’s sales growth outpaces industry averages, underlining the effectiveness of these investments in driving business expansion and performance.
Technical analysis and price prediction of RTO stock
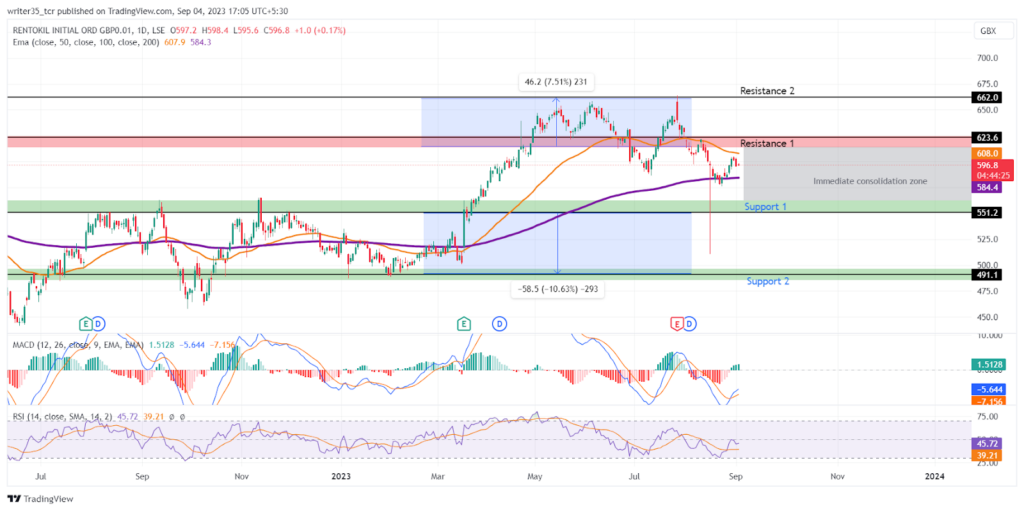
The RTO stock price showed a breakout after the bulls broke past the level of £551 during the initial days of April. The bulls did not stop before breaking another resistance level of £623. This breakout resulted in the stock making its all-time high of £663.
At present, the RTO stock price is riding down from its immediate resistance of £623 while surfing its 200 EMA which is at the level of £584, providing support to the bulls. Moreover, the immediate support level is down below at £551 while a second support awaits underneath at £491.
Between these supports and resistances, indicators like the 50 EMA are sitting up at the level of £607 with the bears in control. Furthermore, the MACD indicator is showing a bullish crossover with its EMA which indicates the strength of the bulls at present. The MACD line is at the level of -5.6 and its EMA is down below at -7.15
The relative strength index (RSI) on the other hand is showing a spike after touching the oversold level of 30, back in August 22. As of now, the RSI line is in the neutral territory of 45 while its SMA, after making a bullish crossover, is at 39.
Is Rentokil Stock Worth Buying?
From an investor’s point of view, the stock can be a good choice to invest in, as the financial analysis of the firm shows that the management is constantly producing growing revenue and can make a positive net profit year-on-year. Additionally, the company is paying regular dividends to its shareholders.
From a short-term perspective, traders may consider going long if the stock surpasses its 50 EMA and the nearby resistance at £623. Conversely, a short position could be considered if the bulls are pushed below the £584 level, with potential targets at £551 and beyond.
Technical levels
Support: £551, £491
Resistance: £623, £662
Disclaimer
The views and opinions stated by the author, or any people named in this article, are for informational purposes only. They do not establish financial, investment, or other advice. Investing in or trading crypto assets comes with a risk of financial loss.




