
 Bitcoin
 Quack AI
 Pudgy Penguins
 Quantus
 Solana
 Injective
 NEAR Protocol
- Transocean has broken out above a crucial consolidation zone.
- The company operates in the industrial services sector like contract drilling.
Transocean Ltd headquarters are situated in Steinhausen. This firm has a total of 5.34K employees. It was founded in 1953 and Jeremy D. Thigpen is the CEO of the company.
The stock moves slightly more than the overall market and can be considered more volatile as the beta of the stock is 2.15. The RIG stock has a 52-week range of $2.33 – $8.86 and the EPS of the share is -1.38 USD. It means the company is making a loss of $1.38 on each share.
The RIG stock does not pay any dividend to its investors but its net income has advanced by +142.6% year-on-year. It resulted in a negative figure of -$165.00 Million for the Q2 2023. The average trading volume of the share is 15.2 Million.
Transocean Ltd Debt Analysis
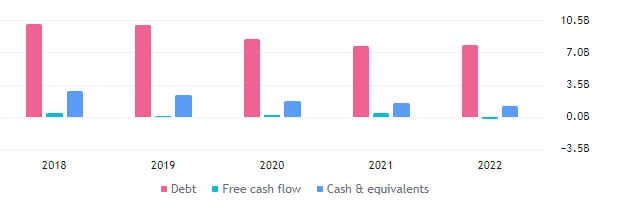
The debt for the company has been consistently declining for the last four years. The current debt of the company for the year 2022 is 7.82 Billion. That resulted in a huge decline of $636 Million in the free cash flow of the company from the year 2021 to 2022.
Transocean Ltd Technical Analysis
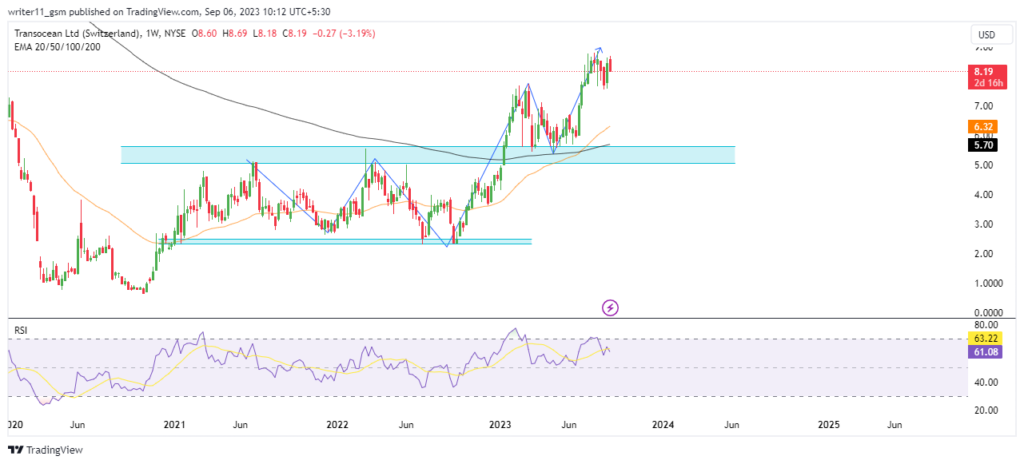
The price of the RIG share spent a good amount of time consolidating in a range. It then led to a breakout above the range. It is currently sustaining above the same, leading to a bullish change of character.
Due to consistent advances in the price, the 50-day and the 200-day Exponential Moving Average has led to a golden cross on charts. It means that the stock is in an uptrend for a larger timeframe. It also means that the price can advance further in the upcoming days.
The RSI for the RIG share has been consistently advancing from lower levels. It is sustaining above the 50-level after hitting the overbought zone. This behavior of RSI represents strength in the market.
Technical Overview of RIG Stock
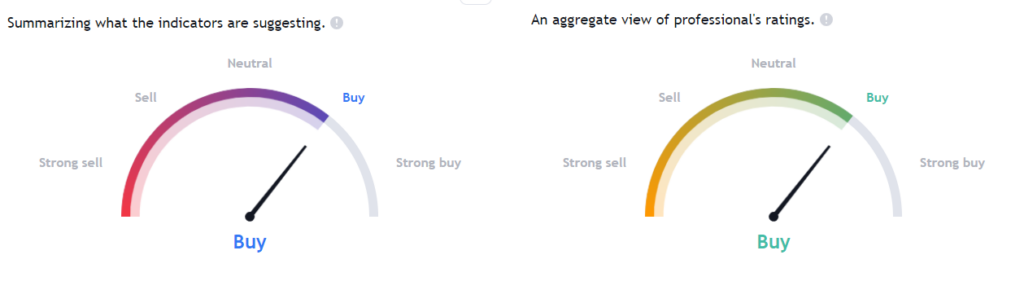
By assessing Tradingview’s summary analysis tool, we can observe that a majority of professional analysts are bullish on the stock. Indicators like EMAs and other oscillators are also bullish on charts. Therefore, the price may touch higher levels in the future.
Conclusion
The RIG share price has been consistently advancing from the lower level. It has broken out above the consolidation zone. Technical indicators like EMA and RSI are also giving bullish signals.
The share’s price may continue to advance to higher levels unless it breaks below the level of $5.00.
Technical Levels
- The support levels for RIG Stock are – $2.30 and $5.50
- The resistance levels for RIG stock are – $9.70 and $14.50
Disclaimer
The information provided in this article, including the views and opinions expressed by the author or any individuals mentioned, is intended for informational purposes only. It is important to note that the article does not provide financial or investment advice. Investing or trading in cryptocurrency assets carries inherent risks and can result in financial loss.




