
 Dacity Coin
 Pump.fun
 Pudgy Penguins
 Bitcoin
 Pearl
Pearl Monad
Monad Zcash
Zcash
- SOL stock is currently trading at $3.16.
- The company’s price is trading inside a falling parallel channel and is trading near its support zone.
Established in 2005, Emeren Group Ltd (NYSE: SOL) has emerged as a prominent player in the global solar industry. With a presence spanning the globe, the company boasts over ten dedicated teams. It strategically positions itself in some of the world’s most rapidly expanding solar markets, specializing in solar power project development, construction management, and project financing services.
Emeren Group Ltd (SOL) Stock: Financial Analysis
Emeren Group’s revenue in 2020 was around $73.50 Million. In 2021, the company generated a revenue of $79.66 Million which showed a growth of 8.38%. However, in 2022, the firm only generated a revenue of $61.29 Million which showed a decline of 23.06%. The trailing twelve month (TTM) revenue for 2023 is currently running at $116.42 Million which shows exceptional growth.
The company’s net income in 2020 was around $2.78 Million. In 2021, the company increased its net income to $6.86 Million. In 2022, the company’s net income was negative $4.67 Million, which showed a decline of 168.08% compared to the previous year. The trailing twelve month for 2023 is running at $15.95 at the time of writing, which shows an exceptional growth in its net income.
The company was doing well in 2020 and 2021 by increasing its finances consistently. In 2022, the firm faced a decline in its finances but currently, the company is growing exceptionally in its revenue, net income, and variable factors.
Emeren Group Ltd (SOL) Stock: Technical Analysis
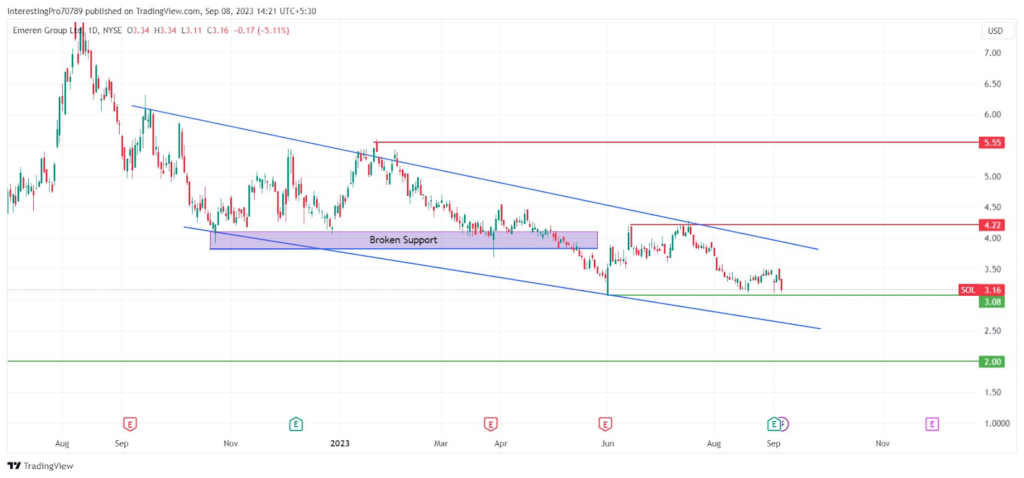
In October 2022, the company’s stock price formed support at $3.83 and commenced a bullish rally. After reaching $5.60, the price faced rejection from the trendline and started to fall. It went back to its $3.84 support zone and was trying to sustain above this.
In May 2023, the price gave the breakdown of the support zone and continued to fall to $3.08. After reaching $3.08, the price took support over there, which made a falling parallel channel. After forming support, the price commenced a bullish rally and reclaimed the $3.83 level. The price tried to sustain above the $3.83 level but after sustaining for some time, it faced rejection from the trendline and again broke below this level.
The price started to fall and fell to the $3.08 support level. Currently, the price is sustaining above the support but if it gives the breakdown of the support, then it may fall to $2.00 support. However, for the price to be in bullish sentiment it must give a breakout of $4.22, after which it may rise to the $5.55 resistance level.
Technical Indicators’ Prediction About the Current Trend
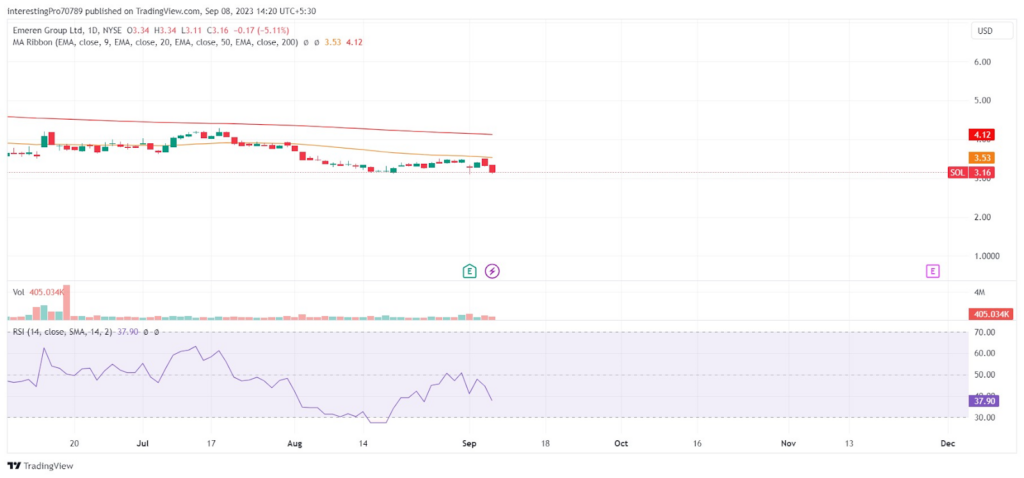
The SOL price is currently trading below the 50 and 200 EMAs, which indicates that the price is under the control of bears.
The relative strength index (RSI) is at 37.90. The RSI line is in bearish territory indicating that SOL’s price is under the control of bears.
Conclusion
The Emeren Group stock is bearish at the time of writing and is trading inside a falling parallel channel. If the price gives the breakdown of the $3.08 support level, then it can be seen falling to the $2.00 support level. However, for the price to gain bullish momentum, it must give the breakout of the $4.22 resistance level, after which it may rise to $5.55.
Technical levels
Resistance levels: $4.22 and $5.55.
Support levels: $3.08 and $2.00.
Disclaimer
The views and opinions stated by the author, or any people named in this article, are for informational purposes only. They do not establish financial, investment, or other advice. Investing in or trading crypto assets comes with a risk of financial loss.




