
 Celestia
 Starknet
 Quantus
 NEAR Protocol
 Pump.fun
 Hyperliquid
 LayerZero
- KYGA stock is trading at 85.20 GBX.
- The sellers are dominating the price by making it continuously fall.
Kerry Group (LSE: KYGA) was founded in 1972. It is a food company that deals in the manufacturing and distribution of food and beverages. The firm operates through two segments which are Taste and Nutrition, and Consumers Foods.
Kerry Group (KYGA) Stock: Financial Analysis
In 2020, the Kerry group gained a revenue of 6.95 Billion GBP. the company increased its revenue to 7.35 Billion GBP. In 2022, the firm increased its revenue once more to 8.77 Billion GBP. The trailing twelve month (TTM) revenue for 2023 is running at 8.77 Billion GBO which is the same as the previous year.
In 2020, the company generated a net income of 554.10 Million GBP. In 2021, the company increased its net income to 763 Million GBP. However, in 2022, there was a decline in the net income which only came up to 606.40 Million GBP. The trailing twelve month (TTM) net income for 2023 is running at 606.40 Million GBP which is the same as the previous year.
The company has been continuously paying dividends to its shareholders over the last three years with an average of 26.8% dividend payout ratio.
As we can see, Kerry Group has been consistently growing its revenue over the past three years but has shown inconsistent growth when it comes to other variable factors. The company’s TTM for 2023 is showing that the company is struggling at the moment to surpass its previous year’s performance.
Kerry Group (KYGA) Stock: Technical Analysis
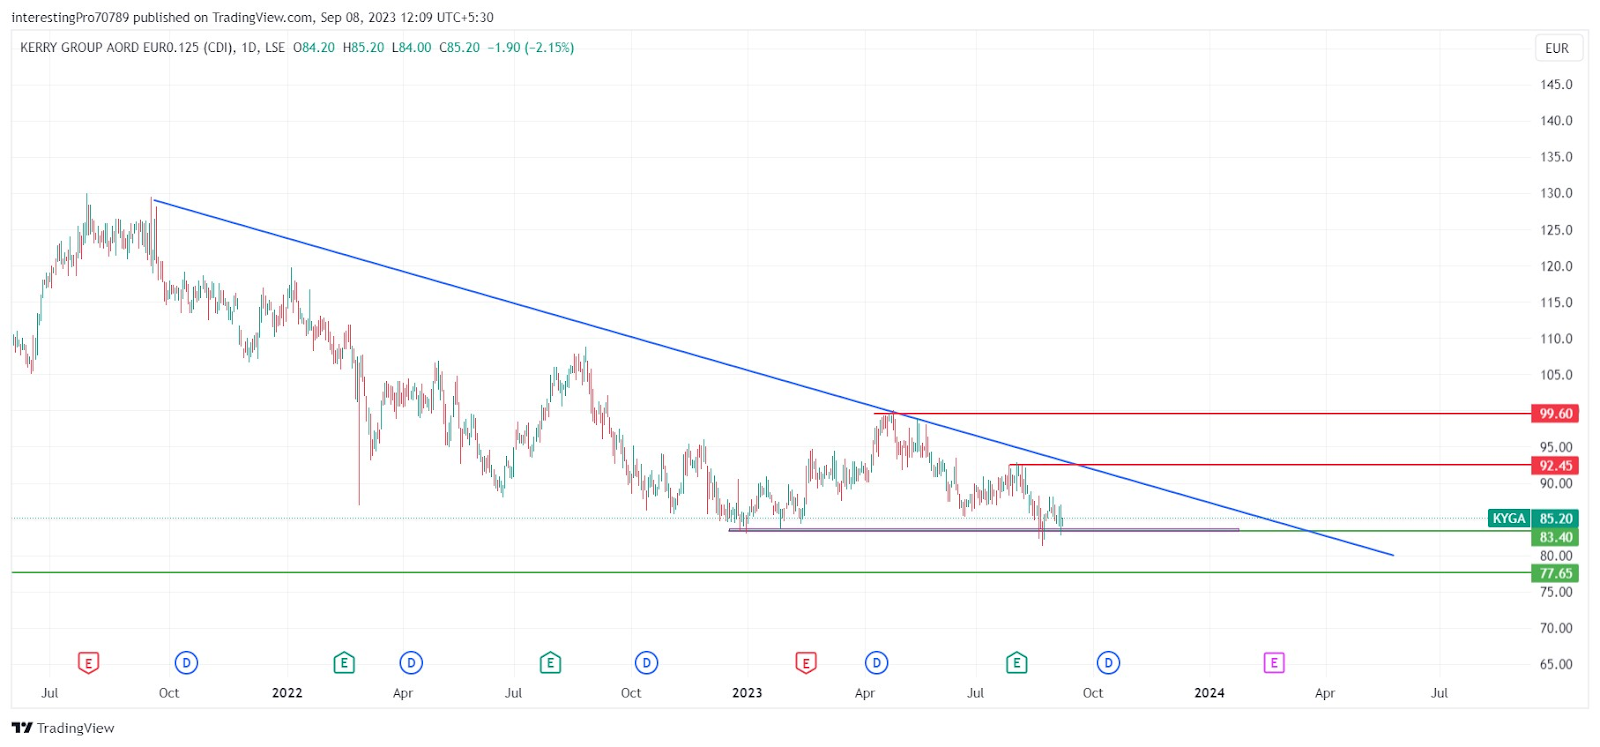
From November 2021 to January 2023, the price has been falling, and the absolute dominance of sellers has been seen over the Kerry stock chart. In January 2023, after the fall, the price formed support at 83.40 GBX and tried to sustain above it. After reaching 83.40 GBX, the price commenced a bullish rally to the trendline.
After reaching the trendline, the price faced rejection from there and started to fall. The price is currently sustaining above the 83.40 GBX support. If the price sustains above the support and gives the breakout of the 92.45 GBX resistance level, then it may rise to the 99.60 GBX resistance level.
However, if the price breaks below the 83.40 GBX support level, then the sellers will continue their dominance and the price could then fall to its 77.65 support level.
Technical Indicators’ Prediction About the Current Trend
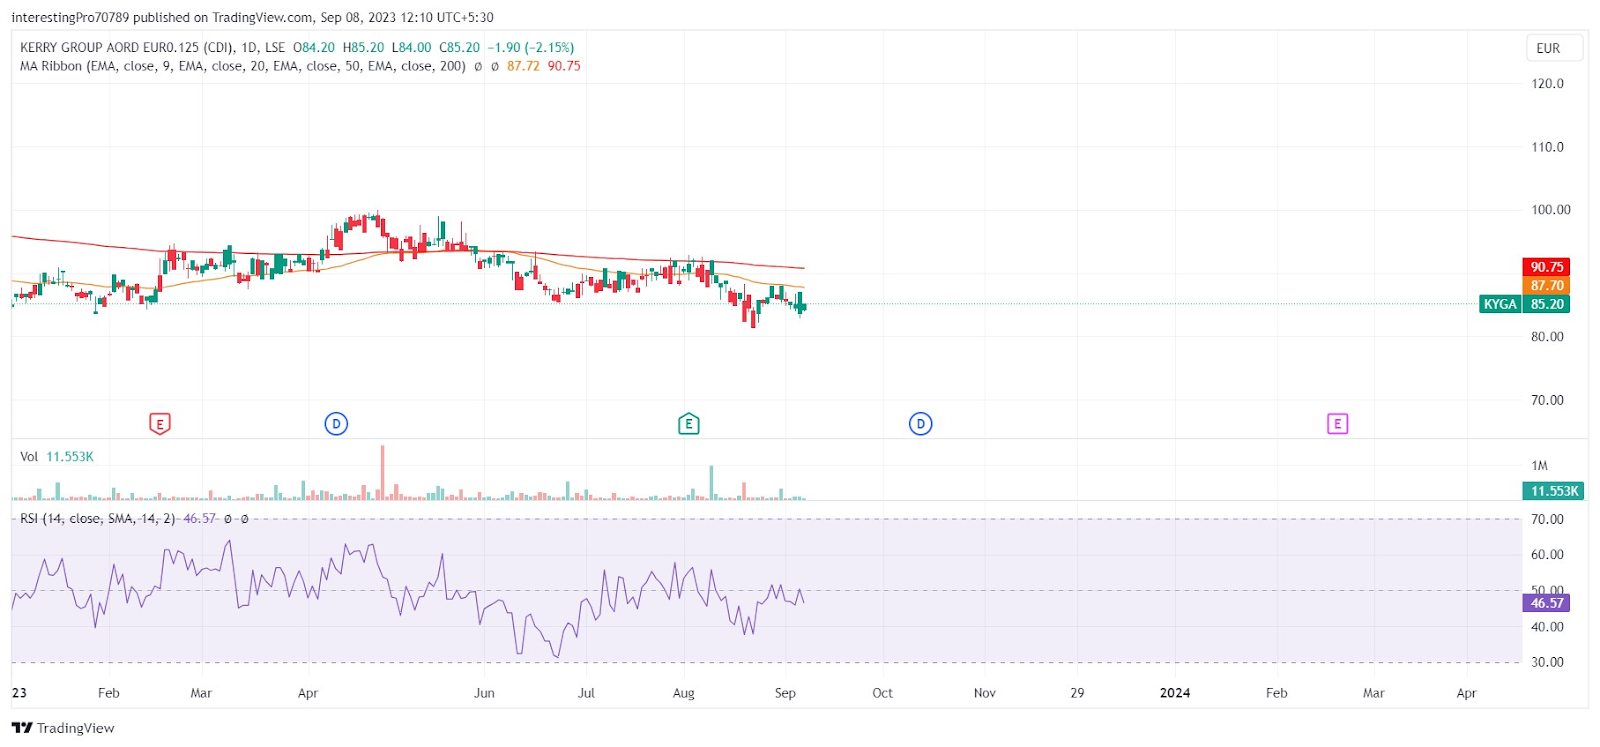
The price of Kerry Group stock is trading below the 50 and 200 EMAs, indicating that the price is currently under the control of the sellers.
The relative strength index (RSI) is at 46.57. The RSI line is in neutral territory, indicating that KYGA price is facing pressure from both sellers and buyers.
Technical levels
Resistance levels: 92.45 GBX and 99.60 GBX.
Support levels: 83.40 GBX and 77.65 GBX.
Disclaimer
The views and opinions stated by the author, or any people named in this article, are for informational purposes only. They do not establish financial, investment, or other advice. Investing in or trading crypto assets comes with a risk of financial loss.




