
 Quack AI
 NEAR Protocol
 Monero
 Lighter
 Ethena
 Pons
Pons Sui
Sui
- The ASTRUSDT coin price is trading at 0.0601.
- The price is trading in a rising parallel channel.
- The coin has been trading with a $6,144,226 volume in the last 24 hours.
ASTRUSDT Coin: Technical Analysis
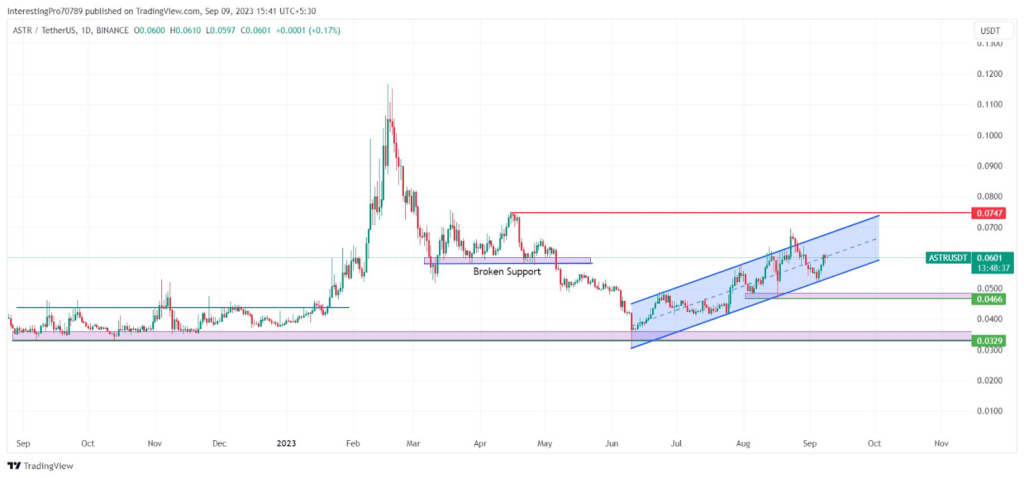
From the first day of January 2023, the price was sustaining above the $0.0329 and was trading in a range of $0.0329 to $0.0436. At the end of January 2023, the price gave the breakout of the range and commenced a bullish rally. The price went up and made the year high of $0.1166.
The moment the price touched the year high of 2023, the price started to face rejection and started to fall. The price fell to $0.0516 and formed a support over it. The price traded above the support zone from 13th March 2023 to 5th May 2023 and formed a double-top pattern over the support zone.
On 6th May 2023, the price gave the breakdown of the support zone and started to fall. The price fell back to its historical support at $0.0329. After the price reached its historical support the price initiated a bullish rally from there and is now trading in a rising parallel channel.
Currently, the price has taken support from the lower trendline of the parallel channel and is moving in the upward direction. If the price continues to trade inside the parallel channel it may rise to the $0.0747 resistance. However, the price breaks below or gives the breakdown of the parallel channel it may fall to its $0.0466 support zone.
Technical Indicators’ Prediction About the Current Trend
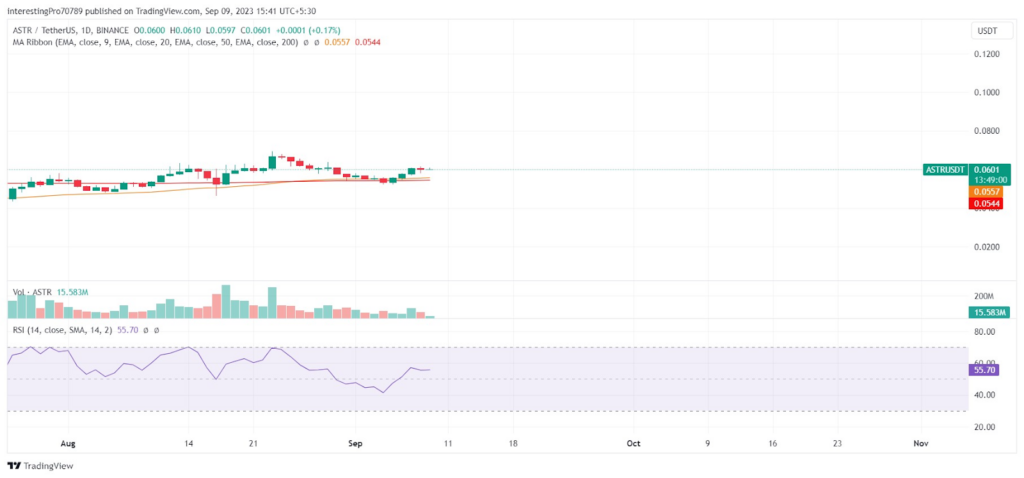
The ASTRUSDT price is trading above the 50 and 200 ema which indicates the price is in bullish sentiment and is in under the of buyers.
The relative strength index is at 55.70. The RSI line is in the positive neutral territory which indicates the ASTRUSDT price is currently facing pressure from buyers as well as sellers. but the buyer’s influence over the price is much stronger than the seller’s.
The long/Short ratio of ASTR shows that the short positions are placed more than the long positions in the last 24 hours. Where long positions are of 47.42% and short positions are of 52.58%.
Conclusion
The ASTR / TetherUS (Binance) is bullish at the time of writing. The price is trading inside a rising parallel channel. If the price continues to trade inside the parallel channel it may rise to the $0.0747 resistance.
However, if the price breaks below or gives the breakdown of the parallel channel it may fall to its $0.0466 support zone.
Technical levels
Resistance levels: $0.0747.
Support levels: $0.0466.
Disclaimer
The views and opinions stated by the author, or any people named in this article, are for informational purposes only. They do not establish financial, investment, or other advice. Investing in or trading crypto assets comes with a risk of financial loss.




