
 hi
hi Boomer
 Lighter
 NEAR Protocol
 Covenant x402
 Pudgy Penguins
 Injective
- The Transocean stock price has been consistently advancing from lower levels.
- A senior Vice president and chief accounting officer sold 57,259 shares of the firm.
Transocean Ltd. was founded in 1953. This company has a total of 5.34K employees. Its headquarters are located in Steinhausen. The company does contract drilling and provides industrial services.
Despite not giving any dividend to its shareholders, the RIG stock has seen a significant increase of +142.6% in its net income compared to the last year. It still reported a loss of -$165.00 Million for the second quarter of 2023. The share has an average trading volume of 15.2 Million.
The stock is more sensitive to market fluctuations than the average, with a beta of 2.15, indicating higher volatility. The RIG stock has traded between $2.33 and $8.86 in the past 52 weeks. It has a negative earnings per share (EPS) of -1.38 USD. It implies that the company is losing $1.38 for every share it issues.
Transocean Ltd. Performance Analysis
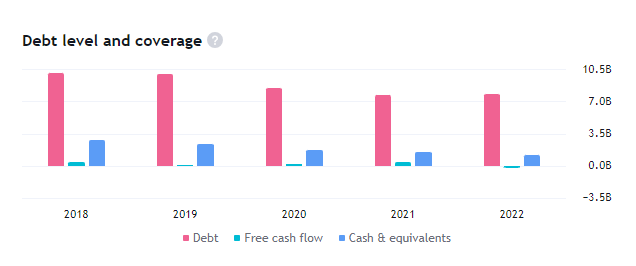
The company’s debt grew from $7.69 Billion to $7.82 Billion in the year 2022. The increased debt caused a reduction in the free cash flow of the company. It has declined by $636.0 Million from the year 2021 to 2022. The company’s net income is negative -24% and the EBITDA is 32%.
RIG Technical Analysis
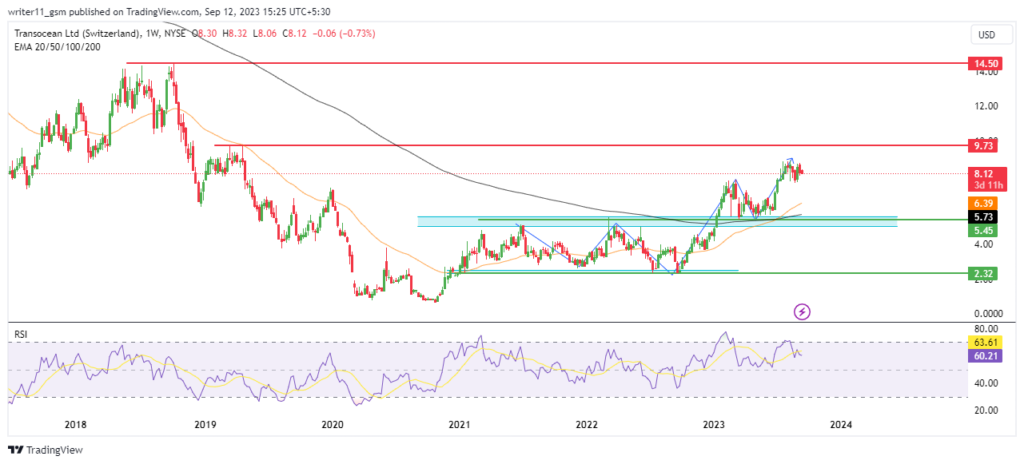
The RIG stock price was trading inside a parallel zone for a very long time. It formed equal highs and lows and later it broke out above the consolidation zone. The stock is currently trading above the same. It is following an uptrend and the price is still making higher highs forming bullish candlesticks.
The consistent advance in price and the breakout above the zone have led to the formation of the golden cross of the 50-day and the 200-day EMAs on the charts. It indicates a bullish signal and an uptrend on charts.
The RSI for the RIG stock is trading above the 50-zone. It has also advanced to the overbought zone, which shows bullishness in the share price. It also indicates that the stock RIG stock value can increase in the future.
Technical Overview of Transocean Ltd. Stock
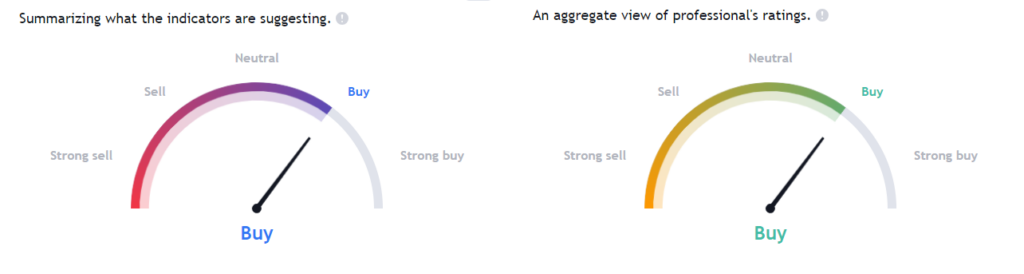
The analysis overview tool of Tradingview is showing a buy signal for the stock as the technicals and the analysts, both are bullish on the stock and indicating for a buy signal.
Conclusion
The consistent advance in price, the breakout above the consolidation zone, and the golden cross in the EMAs and the RSI are bullish signals. The technical overview tool is also giving a buy signal. Therefore, the RIG share price is expected to advance to higher levels in the upcoming days.
Technical Levels
- The support levels for RIG Stock are – $2.3 and $5.5
- The resistance levels for RIG stock are – $9.70 and $14.50
Disclaimer
The information provided in this article, including the views and opinions expressed by the author or any individuals mentioned, is intended for informational purposes only. It is important to note that the article does not provide financial or investment advice. Investing or trading in cryptocurrency assets carries inherent risks and can result in financial loss.




