
 streamoors
 IGNITION
 Injective
 NEAR Protocol
 Quantus
 Pearl
Pearl Aerodrome Finance
- KuCoin has partnered with STOIC AI.
- KCS is currently trading at $4.47 with an intraday rise of 2.13%.
- The token is down by 84.48% from it’s all-time high.
Recently, KuCoin has partnered with the Stoic AI, where you can add Stoic to your KuCoin account and you can intensify your trades using the AI.
The token is currently trading with an increase in the volume by 0.2%.
The token marked its all-time high on 1st Dec 2021 where the price of a single token was $28.80.
- The present circulating supply of the token is 96.73M KCS which is 56.86% of its total supply.
- The token has a market capitalization of $432.099M.
- The 24-hour trading volume of the token is $7.19M.
SENTIMENT ANALYSIS :
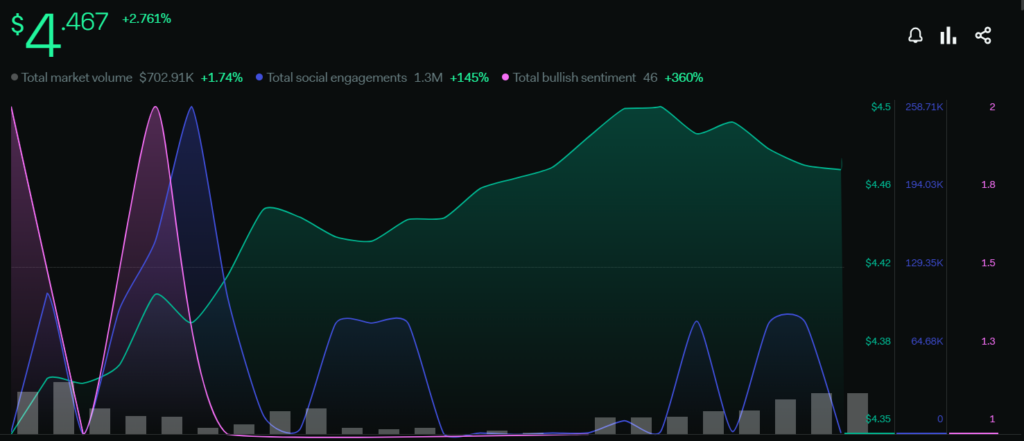
The value of the token has increased by 2.761% and the total market volume has also surged by 1.74% in the last 24 hours. The total social engagements have recorded a rise of 145%. The total bullish sentiments are increased by 360% as the token is giving bullish signals. The overall sentiments are indicating a positive change in the price of the token.
TECHNICAL ANALYSIS (DAILY – 1D ) :
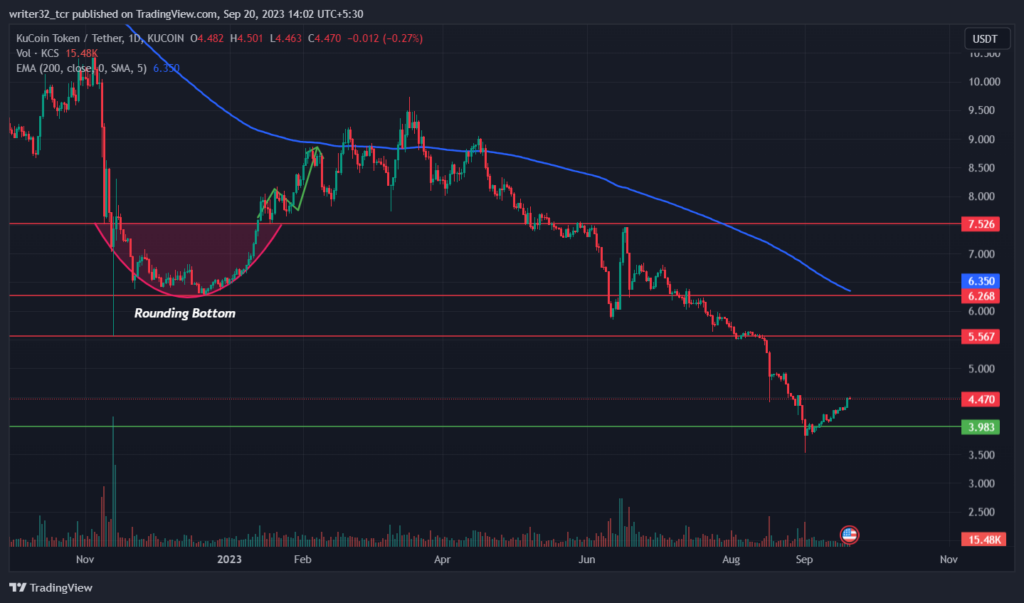
The token has recorded almost 32% losses in the price in the last 3 months and 50% in the last 6 months. The token has been in a downtrend from the month of april this year and the price has been falling very aggressively. There has been a lot of selling pressure from the last few months which brought prices down.
The price also created a rounding bottom between the prices levels of $6.2 and $7.5 from where the price gave an upward bullish price action from the breakout of the rounding bottom pattern.
The price is also currently trading below the 200 day EMA which shows the bearishness in the price levels of the token. The token is currently taking support from the $3.9 range from where the price can bounce back and start an upward trend.
Firstly, The token has to cross the last lower low of $4.9 to confirm that the token has broken the downtrend pattern. The token has to break some major level resistance to reach the $8 range.
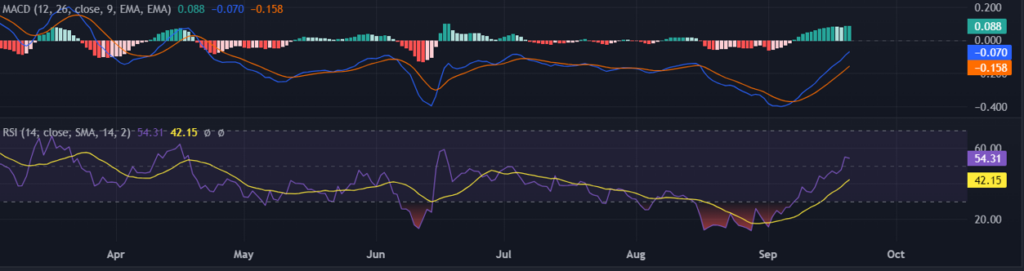
Relative Strength Index ( RSI )
The line of RSI is currently moving at 54.31 points and the SMA 14 line is moving at 42.15 points. The RSI is above the neutral level 50 which indicates there is ongoing buying of the token which is a positive sign for the price action.
Moving Average Convergence/Divergence ( MACD )
In MACD, The fast blue line moving average is moving above the red slow line moving average and the histogram daily is showing increase in the volumes which is a bullish sign for the price. The volume has significantly increased in the last few days.
KCS LIVE CHART :
CONCLUSION :
The price after breaking the last lower low and crossing the resistance of $5.56 will confirm an uptrend in the token. The bullish investors have to be more active with an immense amount of trading volume and keep on dominating the bearish investors as they will try to put the price in a downtrend.
Also, If the price gets rejected from the last lower low and the selling pressure comes then the price will continue its downtrend.
TECHNICAL LEVELS :
SUPPORT : $3.9
RESISTANCE : $5.56, $6.2 AND $7.5
Disclaimer
The views and opinions stated by the author, or any people named in this article, are for informational purposes only and do not establish financial, investment, or other advice. Investing in or trading crypto assets comes with a risk of financial loss.




