
 Quack AI
 NEAR Protocol
 Pudgy Penguins
 Pearl
Pearl Quant
Quant Quantus
 Sui
Sui
- Thermo Fisher Scientific’s stock price is trading at $501.59, which has declined by $3.30 in today’s market session.
- Thermo Fisher Scientific Inc. has a YTD decrease of 9.35%
The Thermo Fisher Scientific Inc. provides instruments, analysis, diagnostics software, and reagents for research. The company was founded in 1960 in Waltham, MA.
Thermo Fisher Scientific Inc. stock is experiencing a bearish trend. The price is forming lower lows, and since January 2022, the price has been continuously falling.
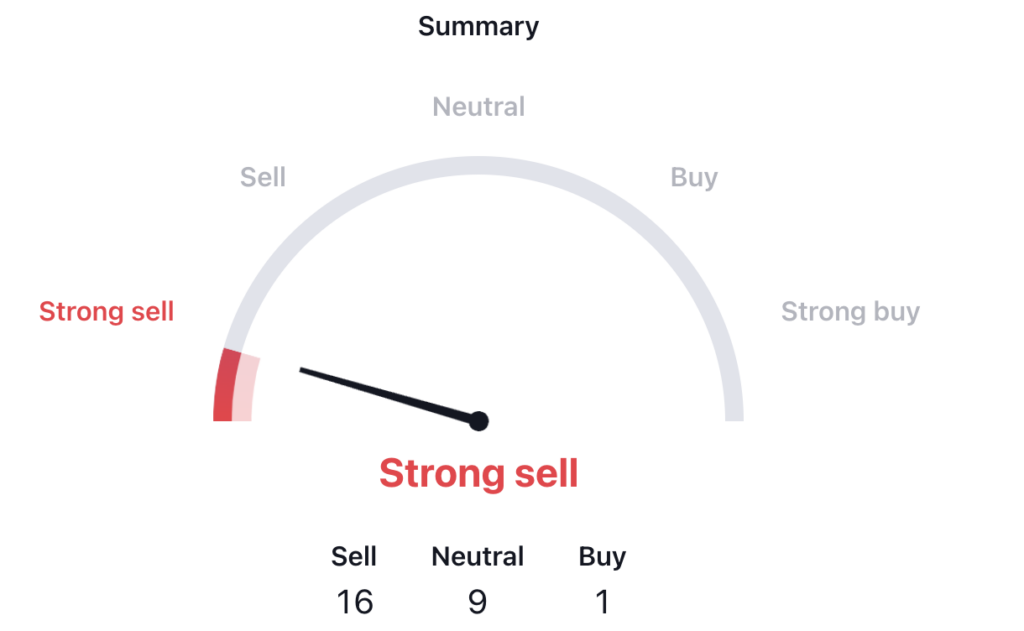
As per the technical summary widget, the TMO stock is showing a strong sell indication. Out of the total 26 indicators, 16 are giving a sell signal. The weakness is generating in the stock and the price is likely to decline.
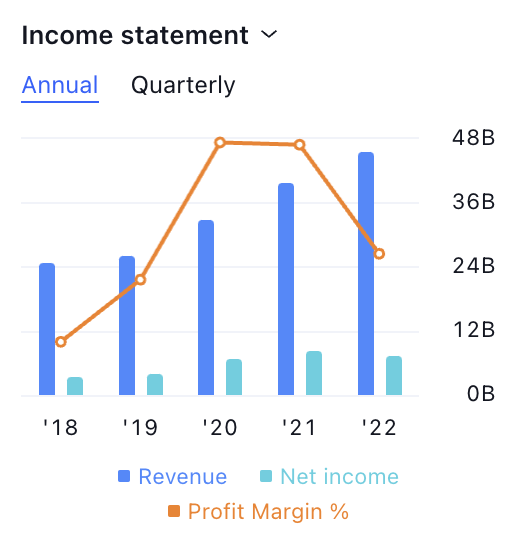
The TMO stock’s income statement reveals a decrease in its yearly profit margin percentage, going from 19.70% in 2021 to 15.4% in 2022, indicating a significant drop in earnings.
In December 2021, the TMO stock reached an all-time high of $672.3 but has declined by 25%. The recent price movement has formed a triangle pattern, and the stock has broken out of this pattern, signaling a bearish trend.
Thermo Fisher Scientific Inc. (TMO) Stock Price Analysis
A by writer50_tcr on TradingView.com
The Thermo Fisher Scientific Inc.’s stock price is below the 100-day and 200 EMA levels, suggesting a weakening price trend and a potential downward move.
The Relative Strength Index (RSI) for the TMO stock is also below the Simple Moving Average (SMA) line, indicating the possibility of further downward movement. The TMO stock may continue to face selling pressure and move lower shortly.
The MACD line is below the signal line, with a red histogram forming, which is a negative sign. It could result in increased selling pressure on the price.
Furthermore, the trading volume for the TMO stock has significantly decreased, and red candles on the charts suggest that sellers are in control, indicating a rising bearish sentiment.
Conclusion
The Thermo Fisher Scientific Inc. stock is following a negative structure. The stock has given a negative return in the previous year, and the earnings are also decreasing. The EMA levels are above the price, and MACD forms a bearish crossover. Hence, the price is likely to decline in the upcoming days.
Technical Levels
- Support – $483
- Resistance – $564
Disclaimer
The views and opinions of the author, or anyone named in this article, are for informational purposes only. They do not offer financial, investment, or other advice. Investing or trading crypto assets involves the risk of financial loss.




