
 Quack AI
 NEAR Protocol
 Zcash
Zcash Celestia
 Pons
Pons Pudgy Penguins
 Bitcoin
- The CTEC stock is hovering around the 50-day and 100-day Exponential moving averages.
- The price fell by 1.41% in a week but surged 1.92% in a month and 4.40% in a year.
- Revenue is steadily rising but there is some issue in net income generation.
Market capital of CTEC stock – $4.423 Billion
The current market price of CTEC stock – $223
CTEC Stock Overview
In the previous session, the stock price surged by $6.8, a rise of 3.15% intraday. The price has declined by 1.41% in a week, which shows that the sellers are still in charge for this week. CTEC stock’s price has risen by just 1.92% in a month and 4.40% in a year. It shows that both the sellers and buyers are finding their way to control the price but have yet to do so.
The company’s revenue has been steadily rising over the years as it has risen from $1.25 Billion in 2016 to 1.68 $Billion in 2022. This firm’s net income has declined during the last 2 years. It dipped from $87.73 Million in 2020 to $51.06 Million in 2022. The company needs to resolve the issue to generate higher net income.
The net debt has been declining steadily over the years but the decline halted in the recent result as the net debt has surged in 2022. The reason for this surge in net debt is that the cash and cash equivalent of the company has declined. The cash was reduced from $342.15 Million to $134.67 Million, a decline of $207.46 Million.
Technical Analysis of CTEC Stock
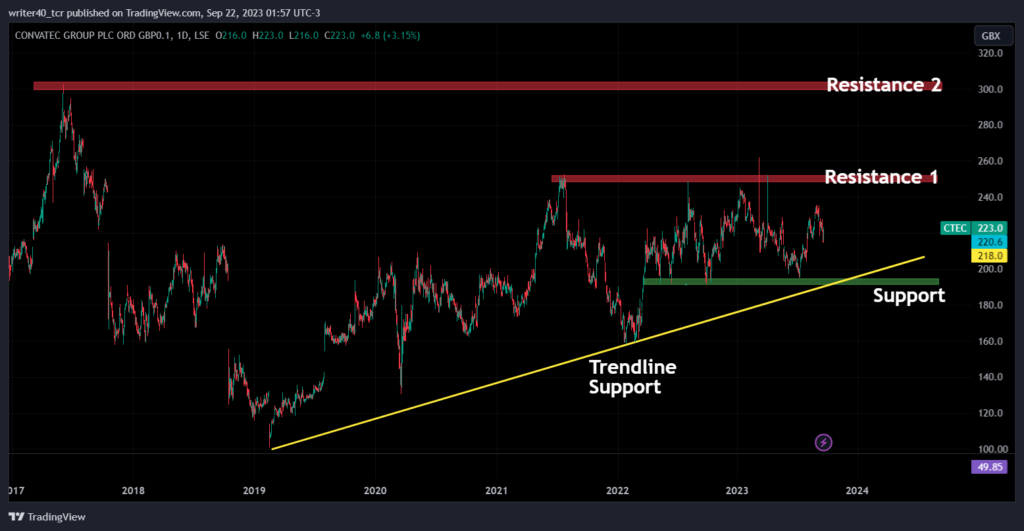
The Stock is forming an ascending triangle pattern on a longer horizon and currently formed a parallel range between $192 and $246. The price has formed a rising trendline, which is currently present near the price of $190. This stock’s resistance is placed at the $245 level as shown in the chart as resistance 1.
The Horizontal support for the price is present between the level of $192 and $194.8. Above mentioned support has been tested thrice till now. The next resistance level is present between the levels of $298 and $302.8.
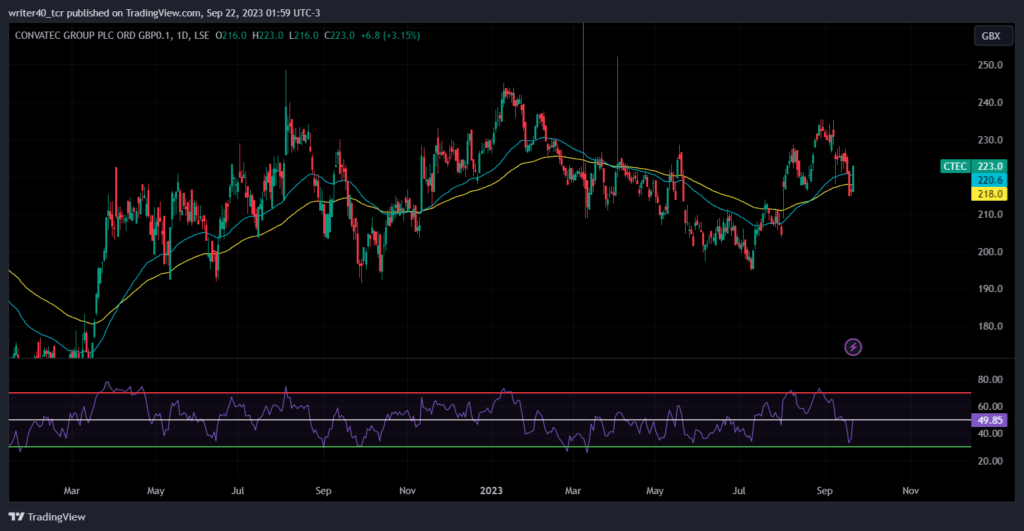
CTEC stock’s price has crossed both the 50-day and 100-day Exponential Moving Averages in its previous trading session. Those EMAs are present at $218 and $220.6. The Relative Strength Index (RSI) is currently placed just below 50. However, it has sharply risen from an oversold trajectory, which indicates that the momentum is turning on the bull’s side.
Conclusion
The price is currently consolidating in a broader range. If the price breaks the resistance level of $252, then it can challenge the sellers who are present near the resistance 2 levels i.e. near $300. Suppose the price gives a breakout below the support level, the sellers will try to challenge the lower level of $160.
Technical levels
Resistance – $252 and $300
Support – $192 and $160
Disclaimer
The views and opinions stated by the author, or any people named in this article, are for informational purposes only. They do not establish financial, investment, or other advice. Investing in or trading crypto assets comes with a risk of financial loss.




