
 Quack AI
 Lighter
 NeoSoul
 Pearl
Pearl Quant
Quant Injective
 Pons
Pons
- Floki Inu is set to break the previous major resistance level at $0.000029.
- FLOKI/USD is trading with a volume of $6,546,213 in the last 24 hours.
- Floki Inu has turned the 20-day EMA into a strong resistance level..
The Floki Inu reached near the major demand zone at $0.000012. Floki will continue to consolidate at this price range until a major bullish impulsive move after which the price will probably break some major resistance level.
FLOKI/USD is currently trading with a volume of $6,546,213, reflecting an 18.39% increase in the last 24 hours. The price is trading below the last support level at $0.00001643 and it will probably reach near the $0.00001367 level.
FLOKI/USD faced significant resistance at its 20-day exponential moving average (EMA) after touching that level. Following this encounter with resistance, the price experienced a decline of approximately -21.48%. This suggests that breaking through the previous resistance level has proven to be challenging for Floki Inu.
Will FLOKI Continue to Decline?
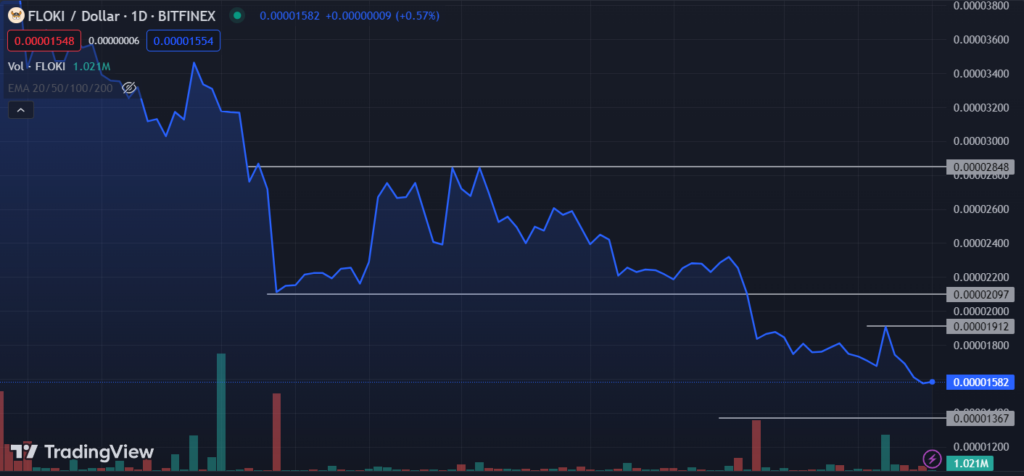
On February 17, 2023, Floki Inu reached its highest value at $0.000054. After that session, the currency’s price began a downward trend characterized by a series of lower swing lows. Currently, Floki Inu is trading at the price level of $0.000015 within this downtrend.
The FLOKI/USD pair is expected to remain in a downtrend unless it can find significant support at specific levels. Attracting investors under these conditions is challenging. The major support level that might provide some stability to this currency is at $0.000012.
However, if the downtrend persists, there is a very low likelihood that the currency will be able to sustain itself at that support level.
Technical Analysis Of FLOKI/USD
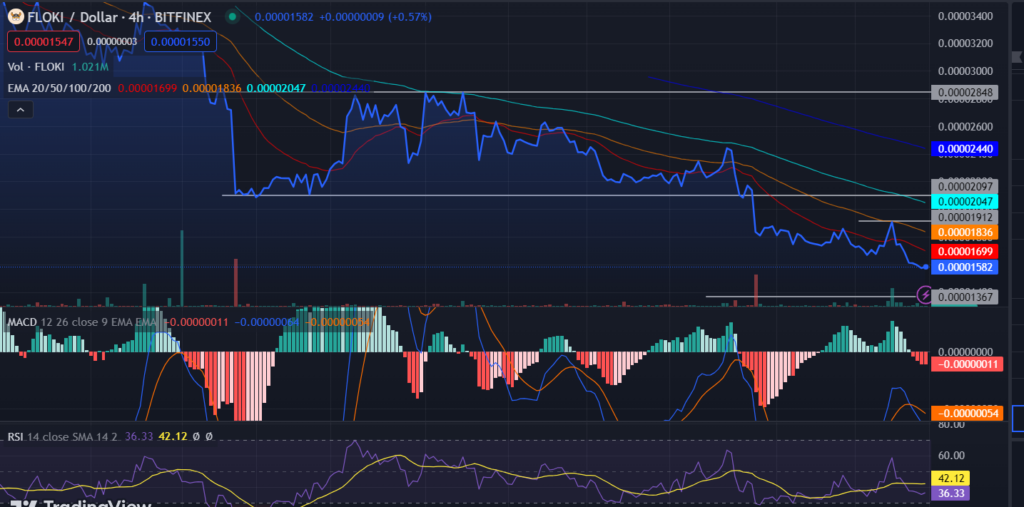
The technical analysis of Floki Inu’s price chart reveals several key points. Firstly, the price action has been respecting previous resistance levels, with recent interaction near the 20-day EMA at $0.000015. This current price position is below all the major EMAs, indicating a strong downtrend.
Secondly, the moving average convergence divergence (MACD) indicator shows a clear preference for bearish volume over bullish volume. Both the MACD line and the signal line are trending in the bearish direction, reinforcing the notion of a downtrend.
Lastly, the relative strength index (RSI) provides insight into the strength of the current trend. The RSI is currently at 36.33, below the signal line at 42.12. This suggests that the average strength of the trend is declining and approaching oversold territory.
Floki Continue Its Trend In Supertrend
Technical Levels
- Resistance Levels: 0.000019 and 0.000028
- Support Levels: 0.000013
Disclaimer
The views and op[inions stated by the author, or any people named in this article, are for informational purposes only. They do not establish financial, investment or any other advice. Investing in or trading crypto assets may come with financial loss.




