
 Quantus
 Pearl
Pearl Quack AI
 Starknet
 NEAR Protocol
 Zcash
Zcash Aerodrome Finance
- The KLAY coin price has gained 2.12% in the last 24 hours.
- The coin chart has been showing a bullish sentiment since the price has formed support at $0.1080.
The KLAY token is the Klaytn blockchain’s native cryptocurrency. This coin’s main use is to perform as a utility token for all the platform transactions as well as the other blockchain applications on the network.
KLAY Coin Technical Analysis
The KLAY coin is currently trading at $0.1139. The coin price has gained 2.12% since the last trading price with a trading volume of $4,768,553. The current coin market capitalization is valued at $365,769,963 and has a circulating supply of 3,182,731,626 KLAY coins in the market.
Technical Analysis on 4-hour Timeframe
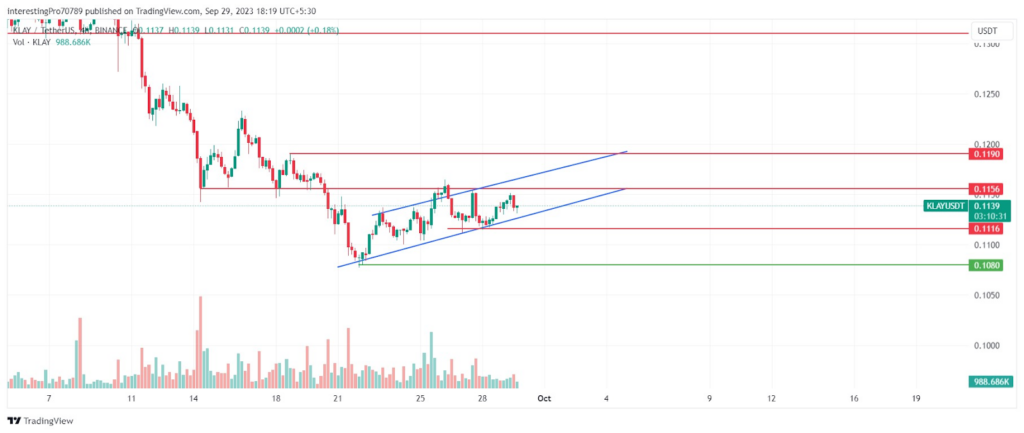
The Klay coin gained 5.43% in last week since the price has formed its support at $0.1080. Its price is trading in a parallel channel since the price has its support at $0.1080.
On 25th September, the price tried to give the breakout of the parallel channel. However, it faced immediate resistance from the $0.1156 level after which it went back inside the parallel channel.
Currently, the price is trading inside the rising wedge pattern and is very close to its $0.1156 resistance. Suppose the KLAY price succeeds at giving the breakout of the $0.1156 resistance, it could reach its next resistance at $0.1190 after sustaining there.
As long as the price is trading above the $0.1116 level, it can be considered a bullish sentiment because of the strong bullish candles formed at that level. However, if the price breaks below the parallel channel and also gives the breakdown of the $0.1116 level, it can fall to its support at $0.1080.
Technical Indicators on the Current Trend
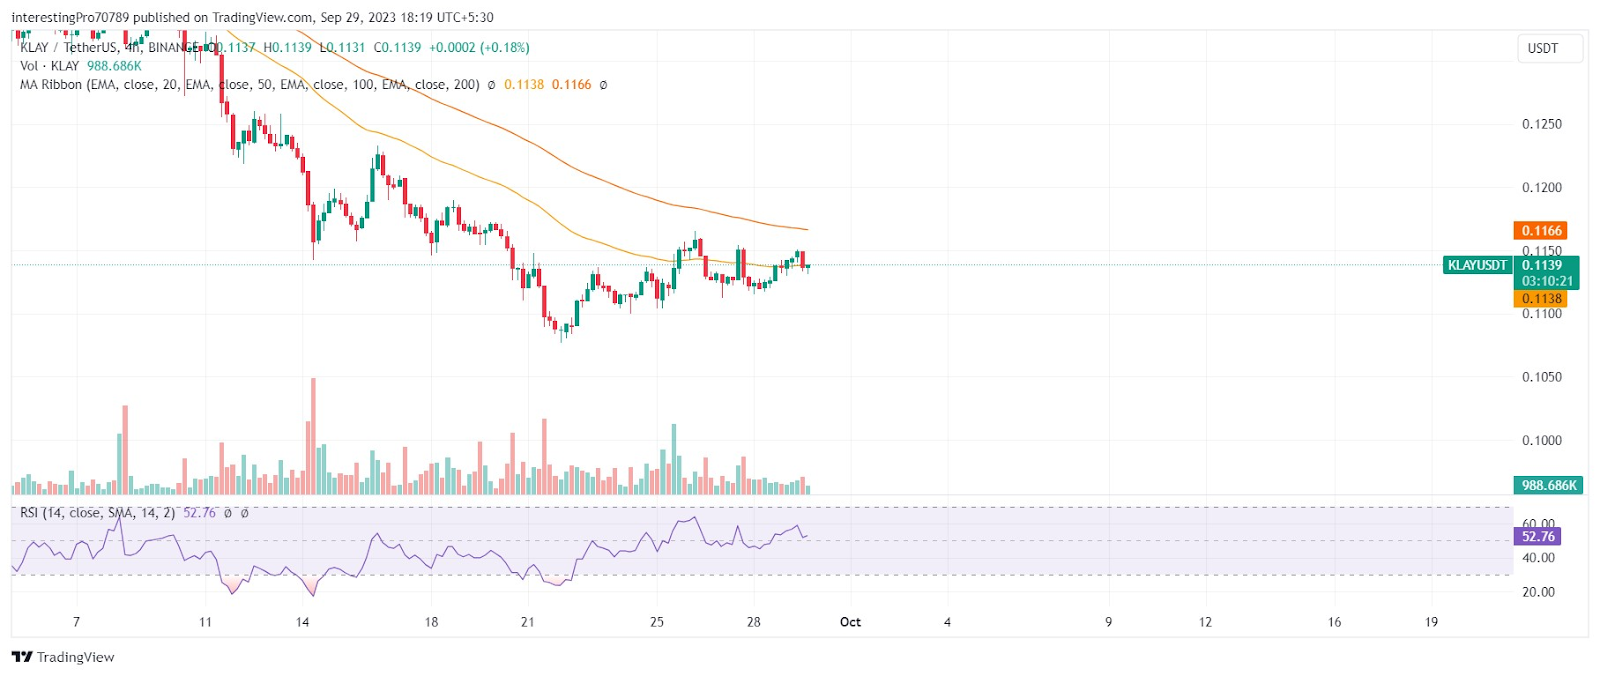
The KLAY coin price is trading above the 20 and 50 EMA. Recently, the price has formed a strong bullish candle by touching piercing above the 50 and 20 EMAs. It shows the presence and control of the buyers in the current scenario.
The relative strength index is above 50 but is sloping in the downward direction. That indicates that despite the buyers in control, the sellers are influencing the price.
Conclusion
In the current scenario, the price is in bullish sentiment but is very close to its $0.1156 resistance. If the price closes above the $0.1156 resistance, it will boost the price to reach its next resistance at $0.1190. As long as the price is trading above the $0.1116 level, it can be seen in bullish sentiment. However, if the price breaks below this level after giving the breakout of the parallel channel, it can be seen falling to its next support at $0.1080.
Technical levels
Resistance Levels: $0.1156 and $0.1190
Support Levels: $0.116 and $0.1080.
Disclaimer
The views and opinions stated by the author or any other person named in this article are for informational purposes only. They do not provide financial, investment, or other advice. Investing in or trading crypto assets comes with a risk of financial loss.




