
 Quack AI
 Pudgy Penguins
 Injective
 Solana
 NEAR Protocol
 Canton
 Zcash
Zcash
- The stock price is down by 0.97%.
- Eli Lilly and Company’s share price is currently trading at $544.45.
- The company stock has been trading with a volume of $2.179 million.
In the last week, the Pharma industry faced a decline of 3.3%. However, the overall growth has been positive within the last 12 months. Last week’s drop-down in the Pharma industry also caused the LLY share price to fall by 9%.
Eli Lilly (LLY) Stock: Technical Analysis
LLY’s stock price is currently trading at $544.45. The company’s stock price has faced a decline of 9% in its last trading session. The current market capitalization of the stock is valued at 516.844 billion USD. LLY stock’s price trades with an average 10-trading volume of $2.686 million.
Technical Analysis on 1-Day Chart
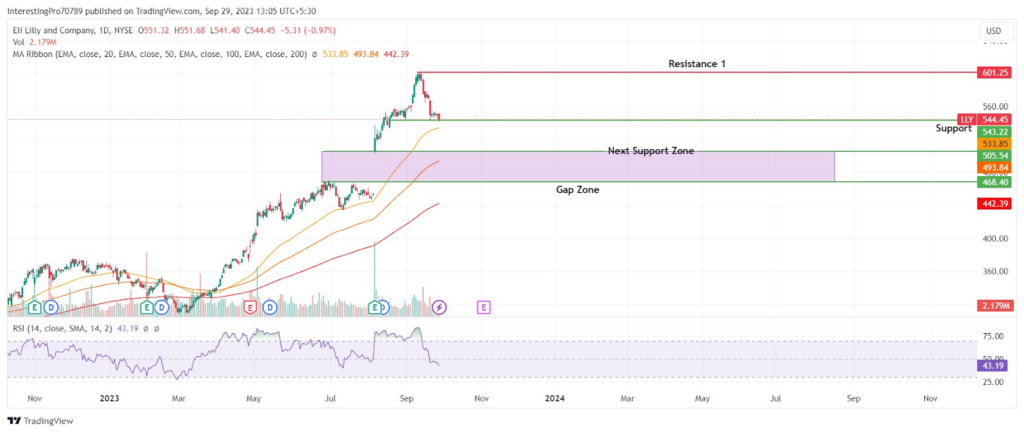
In the 1-day chart, the overall sentiment of the price is bullish. The price has left a gap in the LLY chart that remains as it was. The price is currently falling after creating its all-time high of $601.25.
The LLY Stock price has fallen by more than 9% in the last 10 trading days after facing rejection from the $601.25 level. It is trying to sustain above the $543.22 level after the fall.
The LLY stock price is currently trading above 50, 100, and 200-day EMAs. It shows the price is still under the bull’s control. It is more likely to take support from the 50 EMA as it is very close to the price.
However, the RSI is below 50 and is sloping in the downward direction. It shows the RSI has reached bearish territory and could move further there as the RSI trends to the downside.
In the current scenario, the price is sustaining above $543.22 after the fall. If it breaks below the $543.22 level, it may continue its fall to its next support at the $505.54 level. As long as the price is sustaining above the $468.40 level, it will remain under bullish sentiment.
Conclusion
The LLY stock’s overall trend is bullish as long as its price sustains above the $468.40 level. The stock price is sustaining above the $543.22 level after falling from its all-time high. The 50 EMA is very close to the price from which it can take support and retest the all-time high again. Suppose the price breaks below $543.22, it can fall to its next support at $505.54.
Technical levels
Resistance levels: $601.18 and $630.10
Support levels: $547.26 and $505.54.
Disclaimer
The views and opinions stated by the author, or any people named in this article, are for informational purposes only. They do not establish financial, investment, or other advice. Investing or trading comes with a risk of financial loss.




