
 Pearl
Pearl Bitcoin
 NEAR Protocol
 Starknet
 Solana
 Quant
Quant Ondo
Ondo
- The LOW stock price has increased by 0.4% in the last trading session.
- The price has recently given the breakdown of the two major supports.
Lowe’s Inc. (NYSE: LOW) is an American retail company that deals in the retail sale of home improvement products. The company provides services like home decor, repair, and property maintenance.
Over the last week, the US Home Improvement Retail industry has been down by 1.3%. The decline faced by the industry has also caused the LOW’s share price to fall.
Lowe’s Companies Inc. Stock: Technical Analysis
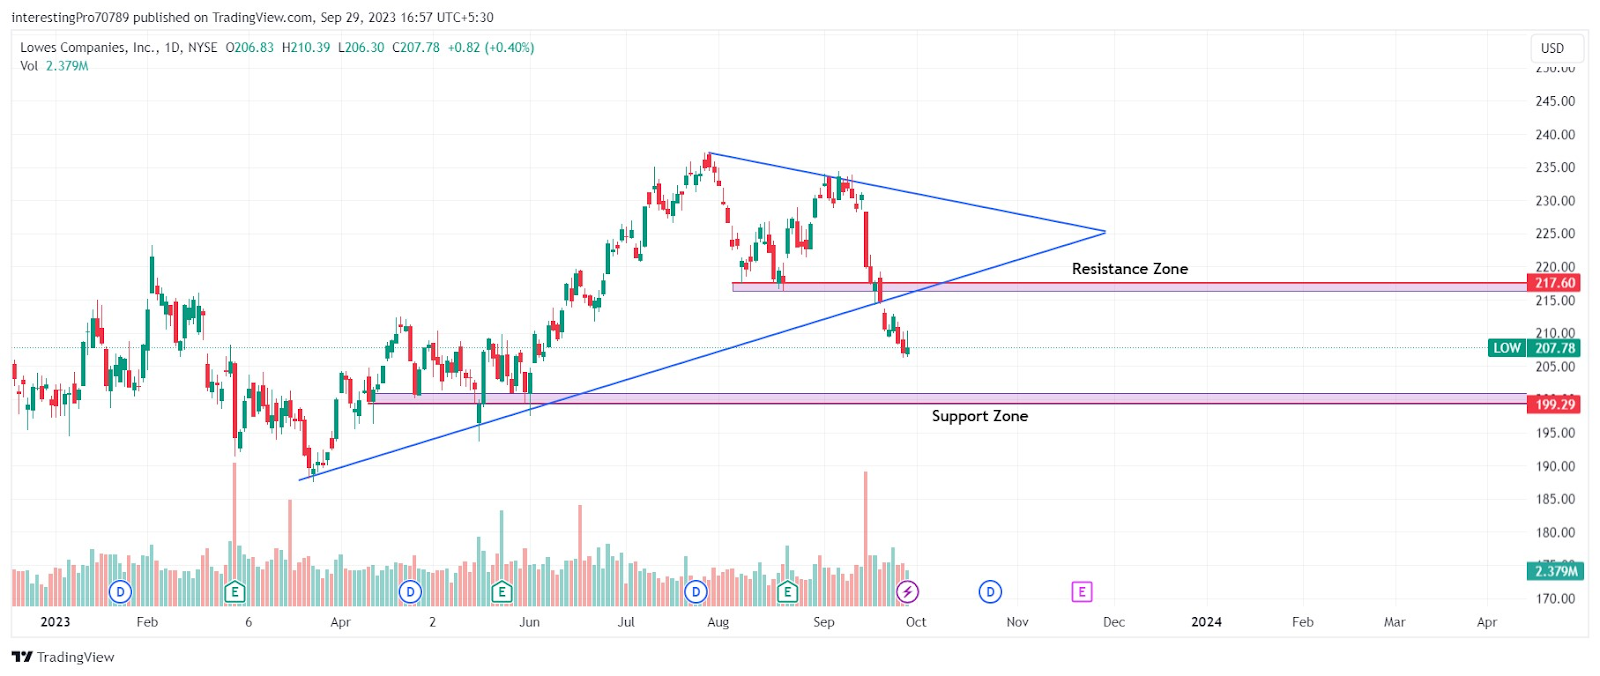
Lowe’s price is currently trading at 207.78 and is up by 0.4% since the last trading session. The company’s market capitalization is valued at 119.913 billion USD. The firm stock price trades with a 10-day average volume of $3.647 million.
The LOW’s share price has been falling for the last 12 days in which it faced a decline of 10.80%. Recently, the price has given the breakdown of the $217.60 support level and also the trendline from which it was taking support.
Currently, the price after giving the breakdown of the two major supports is trading below them. In the last trading session, the price formed a bearish shooting star candle, showing the presence of the sellers.
The selling pressure from the top is very strong. So, it is currently not possible for the price to be in bullish sentiment. If the next candle breaks the low of the recent candle, the continuation of the downtrend will resume at $199.29. Otherwise, the price could consolidate here.
Technical Indicators on the Current Trend
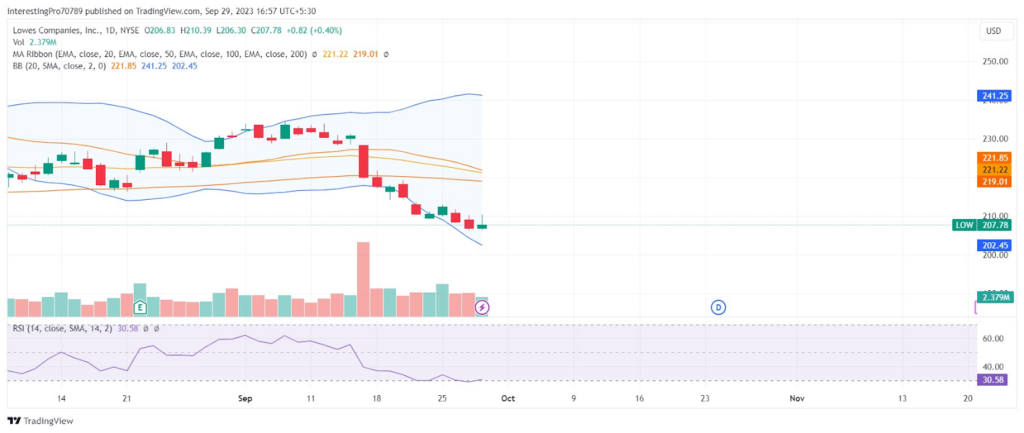
The price has recently broken below the 50-day and 100-day EMAs with a strong bearish candle and is trading below it. That indicates the LOW price is under the strong control of sellers.
The relative strength index is below 50 RSI level which is marked as a bearish territory. The sellers are the ones who have taken control of the price in the current scenario.
The Bollinger bands have also expanded showing the increase in volatility in the Lowe chart.
Conclusion
The LOW stock price is bearish at the time of writing. The price has recently given the breakdown of the two major supports. The price is currently trading below them and showing the stronghold of sellers over the price. The price’s next support zone is at $199.29 from where the price may seen taking support. All the indicators are bearish at the moment and are pointing towards the continuation of the bear market.
Technical levels
Resistance Levels: $217.60.
Support Levels: $119.29.
Disclaimer
The views and opinions stated by the author or any other person named in this article are for informational purposes only. They do not provide financial, investment, or other advice. Investing in or trading comes with a risk of financial loss.




