
 Quack AI
 Lighter
 NeoSoul
 Pearl
Pearl Quant
Quant Injective
 Pons
Pons
- Tech stocks are slipping from higher levels, leading to a decline in NNDM price.
- Nano Dimension is following a downtrend trading in a range.
The NNDM Ltd. stock price has declined by $0.06. It is currently trading at a level of $2.66. NNDM is trading with an average volume of 2.75M and the current market cap of the stock is 646.978M. As of 2022, the company has 257.79 Million floating shares trading in the market.
The beta for the stock is 1.33 and the following value of the beta represents that the stock is 30% more volatile than the overall market. It depicts that the share price moves more than the market as a whole. The company has a negative PE ratio of -4.59, following a negative operating margin of -206.49%. It is not a good number for the performance of the company.
Nano Dimension Ltd. was founded in the year 2012 and has 553 employees in total. Yoav Stern is the current CEO of the company and it has its headquarters in Ness Ziona, Israel. The company provides additive electronics and its flagship product is the Dragon Fly IV system.
Nano Dimension Ltd. Performance Analysis
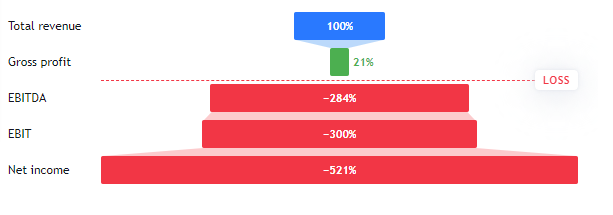
The revenue of the company has been consistently advancing from the year 2020. However, there has been a huge decline in the net income and profit margin of the company. It resulted in a decline of -521.22% in the year 2022 as compared to the year 2021. The company also has $17.22 Million as debt as per the financial data for the year 2022.
NNDM Technical Analysis
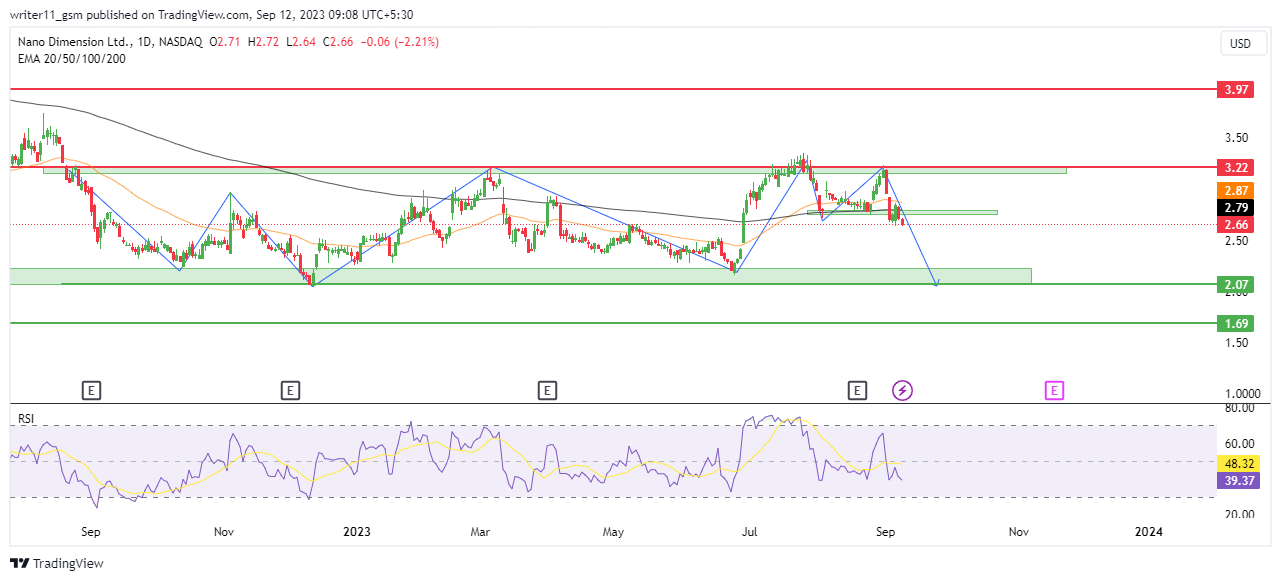
NNDM share has been consistently trading in a range for more than a year. It is still consolidating inside the same parallel channel. In the smaller timeframe, the share price has recently broken down below a crucial support. It is expected to decline up to the lower band of the channel.
The RSI for the stock has taken rejection from the higher levels. It has declined below the 50-level and is currently trading below the same. It indicates weakness in the prior trend of the stock and this behavior of the RSI indicates weakness in the stock price.
Due to the consolidation in the price of the NNDM share, the 50-day and the 200-day EMAs are trading flat, indicating the market to be non-directional. The price has currently declined below the 200-day EMA, which means that the price is below its 200-day average price. It represents a weakness in the price of the stock.
Technical Overview of NNDM Stock
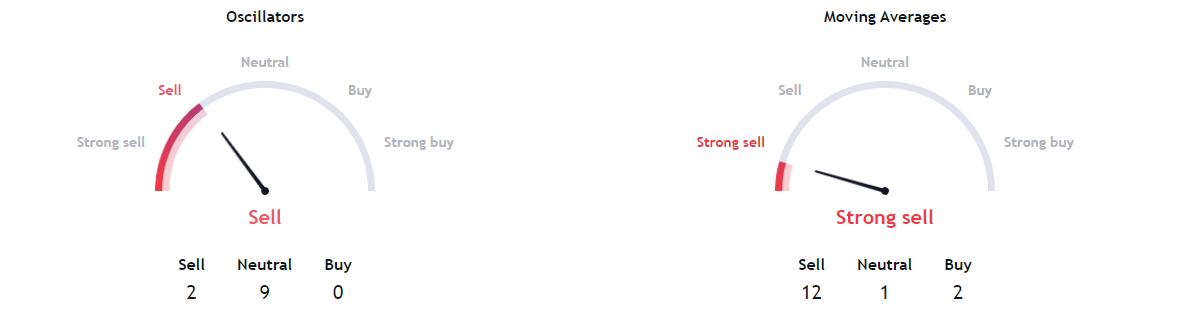
By looking at the daily timeframe analysis on multiple indicators, we can see that a majority of the oscillators and EMA’s are bearish on charts. It indicates that the price is following a downward momentum.
Conclusion
The NNDM share price has been consistently following a range for a very long time. The stock price is expected to hit the lower support levels of $2.07 as the price has broken crucial support. Indicators like EMA and RSI are also indicating a sell signal. The company’s financials also are not good, which can shed the buyers’ sentiment in the stock.
Technical Levels
- The support levels: $1.70 and $2.00
- The resistance levels: $3.20 and $4.00
Disclaimer
The information provided in this article, including the views and opinions expressed by the author or any individuals mentioned, is intended for informational purposes only. It is important to note that the article does not provide financial or investment advice. Investing or trading in cryptocurrency assets carries inherent risks and can result in financial loss.




