
 Quack AI
 NEAR Protocol
 Monero
 Lighter
 Ethena
 Pons
Pons Sui
Sui
- The SPGI stock Price has gained 1.51% in the last trading session.
- The stock price has recently given the breakdown of its $380.99 support level.
S&P Global Inc. (NYSE: SPGI) is an American trading company. It deals in the provision of transparent and independent ratings and analytics to the capital and commodity market worldwide.
S&P Global Inc. (SPGI) Stock: Technical Analysis
The SPGI stock price is currently trading at $368.53 with a 10-day average volume of $1.312. The current market capitalization of the stock is USD 117.266 billion.
Technical Analysis on 1-Day Chart
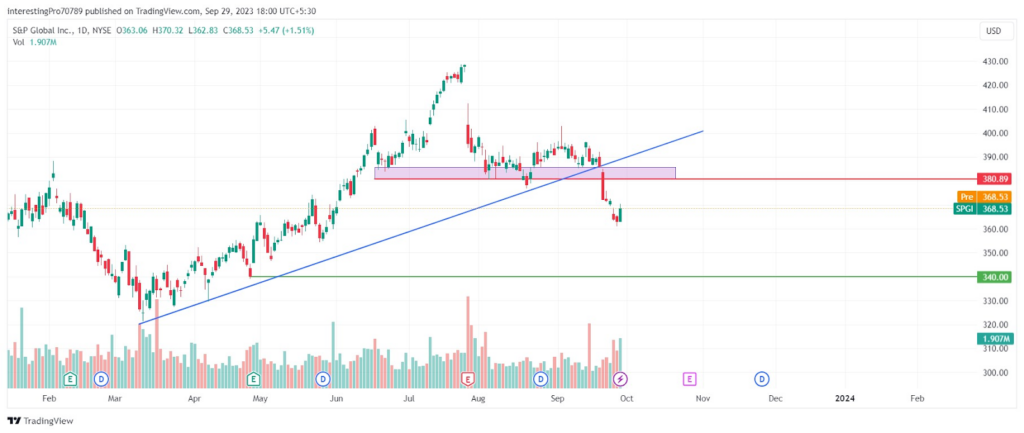
This stock has recently given a breakdown of $380.89 level after sustaining above it for almost 3 months. Its price has fallen by 4.05% from the day it gave the breakdown of the support.
Currently, the price is trading below the support level. On the last trading day, the price formed a bullish candle with a spike in its volume bar, showing the interest of buyers. If the buyers show interest, the price would reach to retest the $380.89 level. However, it will be difficult for the buyers to continue the bullish momentum after that.
The SPGI stock price is in a downtrend or bearish sentiment. It could fall to the $340.00 level if the next candle closes below the current candle low. In case that does not happen, the price may go up to retest the $380.99 level, which is acting as a resistance now.
If the price forms a strong bearish reversal candle at the $380.99 level at the time of retesting, it can fall from there. That would be a great opportunity for the sellers who didn’t invest their money at the time of the breakdown.
Technical Indicators on the Current Trend
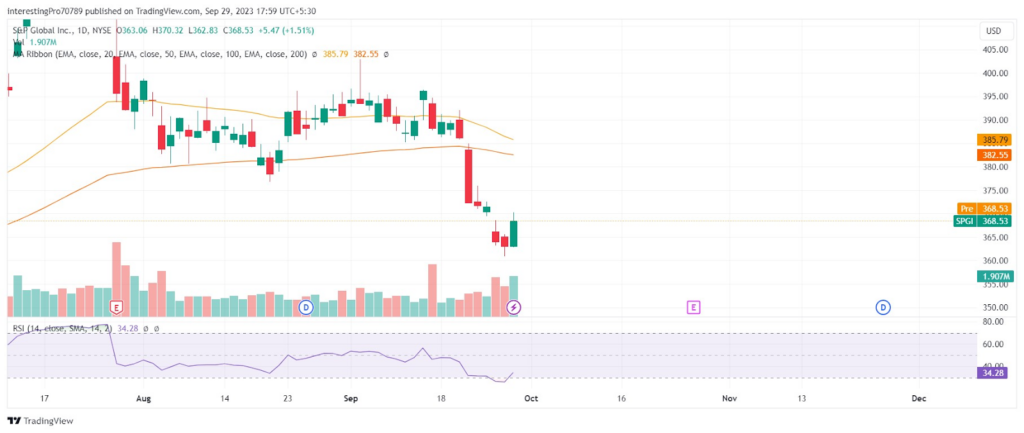
Recently a strong bearish candle has been formed after facing resistance from the 100 EMA. The price is also trading below both 50 and 100 EMAs. This shows the presence of sellers in the current scenario. However, the price is trading far from the EMA lines, indicating the price could rise in the future retest them.
The relative strength index is below 50, which is being observed coming from the oversold territory. That indicates a short-term recovery in the price is going on or a short-term pullback is due for the future.
Conclusion
The SPGI stock price is in bearish sentiment after giving the breakdown of its major support level of $380.89. The indicators are pointing towards the short-term pullback in the price. There are two possibilities that could happen in the current scenario. Firstly, if the next candle closes below the current candle’s low, the price could be seen falling from here only.
Secondly, the price could rise up to $380.99 resistance to retest it. After retesting that level, it could form a strong bearish reversal candle for the continuation of the bearish trend till the $340.00 level.
Technical levels
Resistance Levels: $380.99.
Support Levels: $340.00.
Disclaimer
The views and opinions stated by the author or any other person named in this article are for informational purposes only. They do not provide financial, investment, or other advice. Investing in or trading comes with a risk of financial loss.




