
 Quack AI
 NEAR Protocol
 Pudgy Penguins
 Pearl
Pearl Quant
Quant Quantus
 Sui
Sui
- The price surged by 2.46% since the last trading session.
- The company chart reflects the bullish sentiment in the current scenario.
The COP price is currently trading at $123.09 and has increased about 2.46% since the last trading session. The market capitalization of the coin is currently valued at $149.399 Billion with a 10-day trading volume of $5.168 Million.
ConocoPhillips (COP) Stock: Technical Analysis
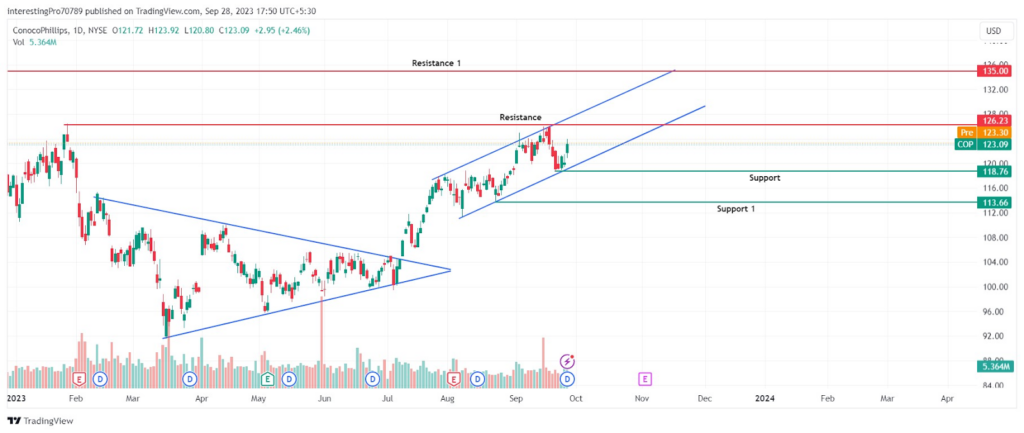
The ConocoPhillips stock price has been in a bullish sentiment since it has given the breakout of the symmetrical triangle. The price is rising in a higher high formation and could be seen trading inside a parallel channel.
In the last three days, the company stock price has gained 3.56%. In the last three trading sessions, after the small pullback, the price formed bullish candles showing the presence of buyers in each candle.
The price has recently made its recent high and low which will act as important levels. If the price gives the breakout of its recent high of $126.33 the continuation of the bullish rally can continue in the higher high formation. Then the price can rise to its next resistance at $135.00.
However, if the price closes below the recent low of $118.76 the sellers could try to reverse the trend and the price could be seen falling to its support at $113.66. Otherwise, the price could be seen trading inside this range.
Technical Indicators On The Current Trend
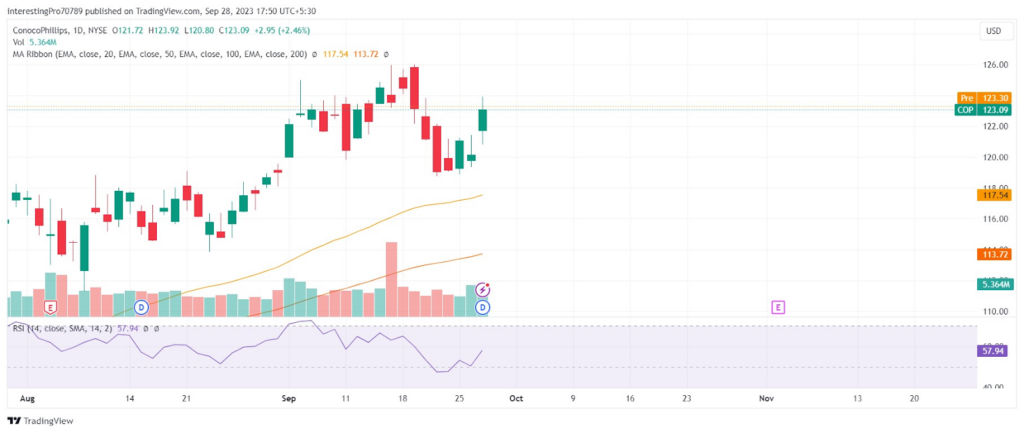
The COP price is currently trading above the 50 and 100 moving average lines. The EMA lines are also trending in the upward direction indicating the buyer’s dominance over the price in the current scenario.
The relative strength index is above 50 and has started to trend in the upward direction after taking support from the 50 RSI level. This indicates the buyer’s dominance and more room for them in the upside to make the price rise.
Conclusion
The COP price is bullish as the price has initiated a bullish rally after giving the breakout of the symmetrical triangle. The price has formed its recent high of $126.33 and
recent low of $118.76 and is trading in between them. These two could act as major levels for the continuation of the price or the trend reversal of the price. If the price closes above its recent high the continuation of a bullish rally can be seen. However, for the price to be in bearish sentiment it must close below the recent low.
Technical levels
Resistance Levels: $126.33 and $135.00.
Support Levels: $118.76 and $113.66.
Disclaimer
The views and opinions stated by the author or any other person named in this article are for informational purposes only. They do not provide financial, investment, or other advice. Investing in or trading comes with a risk of financial loss.




