
 Minter
 Quack AI
 NEAR Protocol
 Sui
Sui Hyperliquid
 Cardano
 Raydium
- The Applied Materials, Inc. stock price retraces toward the $146.83 level after forming the Ascending broadening wedge pattern.
- The year-to-date return of the stock is 41.94% while observing a decrease of -9.52% in a month.
Applied Materials, Inc. was founded on November 10, 1967. It is an American corporation that supplies equipment, services, and software for the manufacture of semiconductor chips for electronics.
Applied Materials, Inc. (NASDAQ: AMAT): Technical Analysis
The AMAT stock price is currently trading at the $138.22 level and witnessing an increase of 2.34% during the intraday trading session. The stock has an average trading volume of $5,669,278 with the previous day’s closing price at $135.06. It has a current P/E ratio of 18.23 and has a total market capitalization of $116,721,568,370.
Technical Analysis of the AMAT Stock
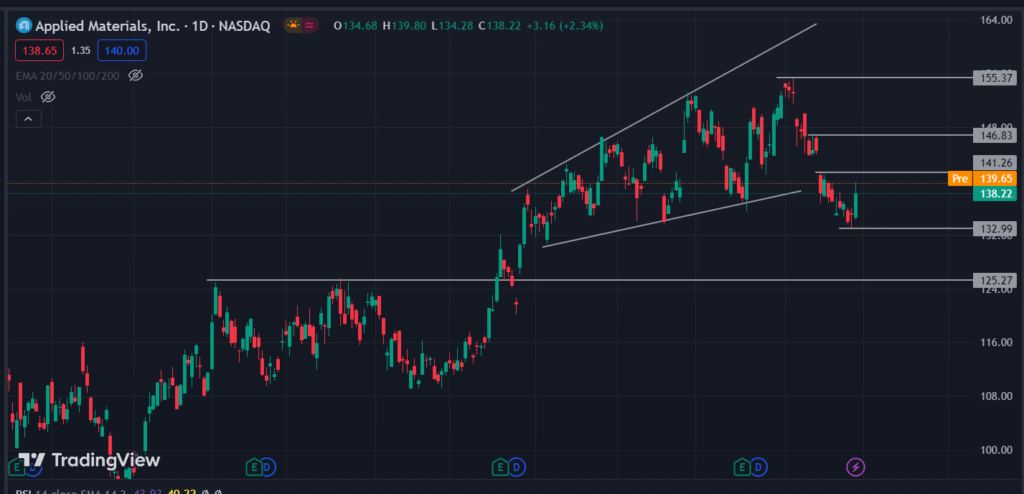
The stock price is trading in a bullish market. In this chart, the price has formed an ascending broadening wedge pattern that got broken down by bears at $135.60. The price retraces toward the $141.26 resistance. It got strong support from the $132.99 level, which prevented the price from declining.
The price is trading at $138.22 near the lower line of ascending broadening wedge after the breakdown of this pattern because of the selling pressure. In the last trading session, the price formed a bullish candle at $132.99. It reflects the price correction at this level.
If the AMAT price gives a breakout of $146.83, it may rise toward the next resistance level at $155.37. If it also breaks above that level, it may continue to trade alongside the pattern. The AMAT stock price may completely shift in a downtrend if it closes below the $132.99 level. It may later fall to the $125.27 level if the downtrend occurs.
Technical Indicators on the AMAT Chart
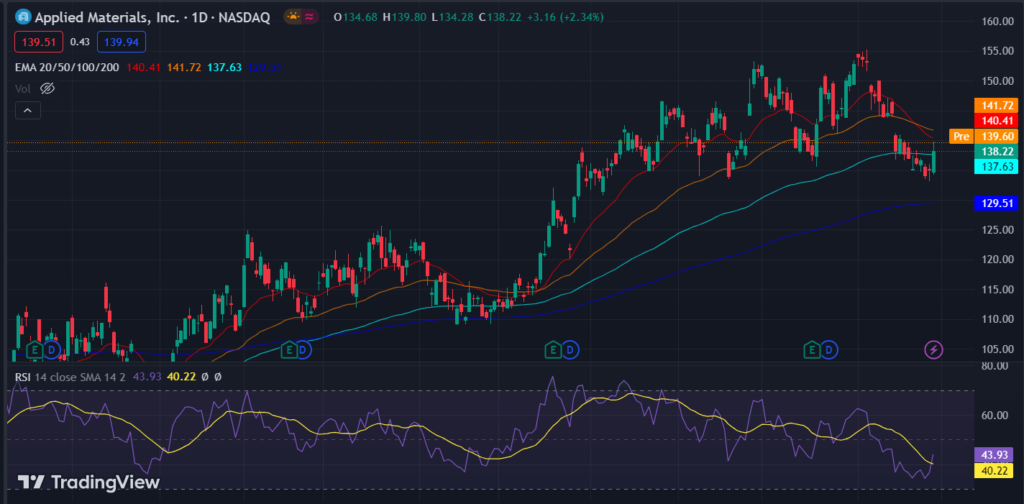
In this chart, the price is currently performing below the 20, 50, and 100-day EMAs and above the 200-day EMA. It shows the bears are trying to shift the market trend.
The Relative strength index (RSI) trades at 43.97, just below the 50-mark middle band. The chart shows the bearish divergence, indicating the bears have control over the price at the moment.
Conclusion
Overall, the AMAT stock price is trading in a bullish trend, but it recently broke down the ascending broadening pattern that can probably shift into a downtrend. So, if the price gives a breakout of $146.83, it may rise toward the next resistance level at $155.37. If it also breaks above that level, it may continue to trade alongside the pattern. However, for the price to completely shift in a downtrend, it should close below $132.99 after which it may fall to the $125.27 level.
Technical Levels
- Resistance Levels: $141.26 and $146.83
- Support Levels: $132.99 and $125.27
Disclaimer
The views and opinions stated by the author, or any person named in this article, are for informational purposes only. They do not establish financial, investment or any other advice. Investing in or trading stocks comes with the risk of financial loss.




