
 Dacity Coin
 Celestia
 Pudgy Penguins
 Injective
 Solana
 Sui
Sui Starknet
- MCD has strong fundamentals. The company reported good revenue in 2022. In Q1 of 2023, it made $5.90 Billion in terms of revenue and in Q2 it made $6.50 Billion.
- McDonald’s is a multinational company which offers food & beverages items all over the world.
- The analysis in this article will be done with the help of technical analysis. Let’s see whether the company is technically strong or not.
Technical Analysis of MCD
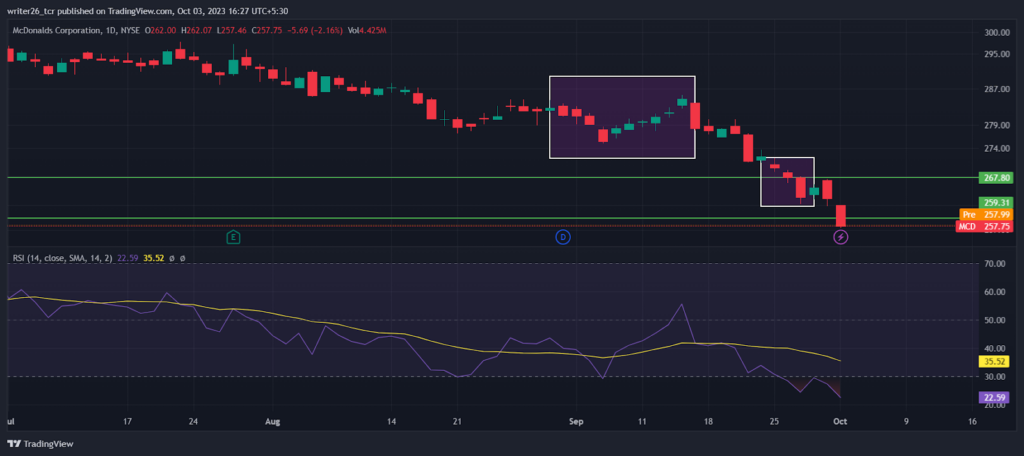
In the first box, the failure of both patterns is seen. The red candle indicates that the price will continue to fall. The direction was changed by the green candle which indicates that the price will move up, but this pattern also failed. In the second box, the pattern was successful and the stock is moving in a downtrend. Overall, the stock was not doing good in September. It has been falling since the start of the month.
Daily Simple Moving Average(SMA)
| Value | Action (Buy or Sell) | Period |
| $ 264.22 | Sell | SMA 3 |
| $ 266.03 | Sell | SMA 5 |
| $ 270.67 | Sell | SMA 10 |
| $ 275.53 | Sell | SMA 21 |
| $ 282.72 | Sell | SMA 50 |
| $ 287.25 | Sell | SMA 100 |
| $ 280.36 | Sell | SMA 200 |
Price Prediction for tomorrow and next week
| Price | Change | Date |
| $ 257.45 | -0.12% | Oct 04 |
| $ 255.98 | -0.69% | Oct 05 |
| $ 256.16 | -0.62% | Oct 06 |
| $ 257.21 | -0.21% | Oct 07 |
| $ 258.38 | 0.24% | Oct 08 |
| $ 261.15 | 1.32% | Oct 09 |
| $ 261.67 | 1.52% | Oct 10 |
Daily Exponential Moving Average(EMA)
| Value | Action (Buy or Sell) | Period |
| $ 263.44 | Sell | EMA 3 |
| $ 264.78 | Sell | EMA 5 |
| $ 268.43 | Sell | EMA 10 |
| $ 273.57 | Sell | EMA 21 |
| $ 279.99 | Sell | EMA 50 |
| $ 282.68 | Sell | EMA 100 |
| $ 279.28 | Sell | EMA 200 |
Based on both technical and fundamental analysis, MCD stock appears to be a favourable investment option. It’s important to note that retracements and corrections are common in the stock market, and they can provide opportunities for investors to enter or add to their positions at more favourable price levels. Overall, in each time frame, MCD is performing brilliantly. The fundamentals also support the stock. The indicators suggest that investors should sell their holdings to book profits.
Live Chart
Summary
In September, the coin did not perform well. The coin price was moving down throughout the month. According to some reports, the coin might drop by 0.40% in the next year. Investors should watch this coin in October to see how it is performing then. They should think about whether to invest or not. It is compulsory to focus on both the fundamentals and technicalities of the coin. The stock might make an all-time high in the future as its momentum is bullish overall.
Levels
Support level- $250
Resistance level- $285
Disclaimer
This is a general article that does not provide any financial or investment information. Investors should focus on both technical analysis as well as fundamental analysis. The analysis is done to provide information to readers. To make them aware of investments.




