
 Minter
 Pearl
Pearl NEAR Protocol
 Pons
Pons Quack AI
 Quantus
 Sui
Sui
- Nikola Corporation (NKLA) stock has a free cash flow of -18%.
- Nikola Corporation’s (NKLA) technical summary reveals a ‘sell’ signal.
- NKLA has a net income of -$845 Million.
The Nikola Corporation (NYSE: NKLA) specializes in delivering eco-friendly transportation and infrastructure solutions, with a focus on designing and producing vehicles powered by battery-electric and hydrogen-electric technologies.
The NKLA stock price is currently in a downtrend, which is particularly noticeable in the weekly timeframe as it hovers at lower levels.
The technical summary indicators reveal a ‘sell’ signal for Nikola stock. Out of a total of 26 indicators, the majority of them reveal a ‘sell’ signal for the stock.
Additionally, the stock does not pay any dividends to its shareholders. This denotes that the stock is performing poorly, and the buyers might take less interest in making a position.
Moving Averages of Nikola stock
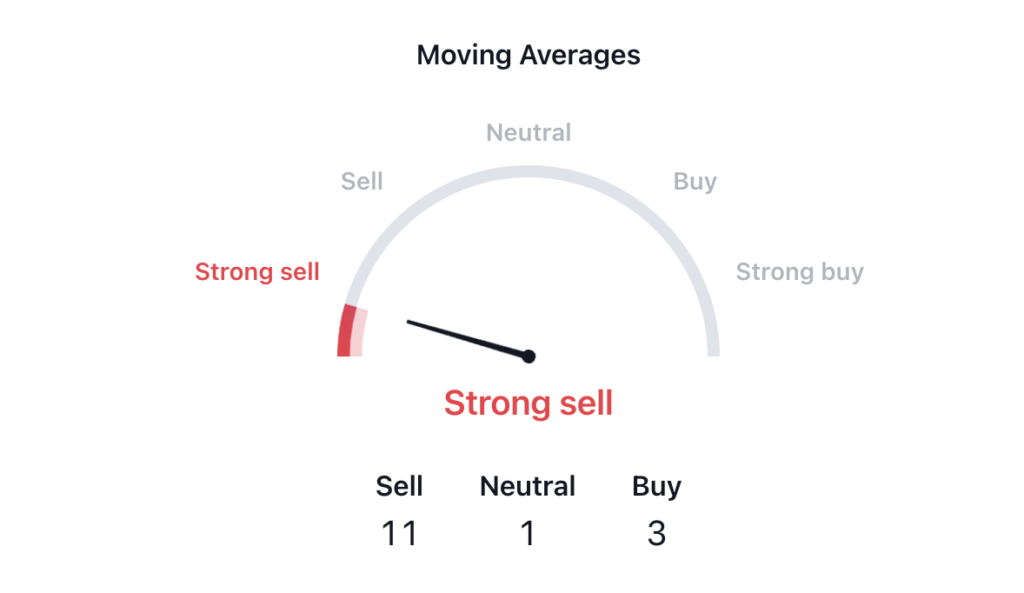
The moving averages of Nikola stock are revealing a ‘strong sell’ momentum. This is a weak signal for the stock price.
The NKLA stock price reached a high of $93.99 in June 2020, but it has since entered a downtrend, resulting in a 98% by the end of June 2023.
The stock is currently trading in a falling wedge pattern. Additionally, the stock is moving inside a falling wedge pattern and making lower lows. The overall pattern for NKLA stock looks bearish, with the possibility of breaking below its support level to establish a new swing low.
Over the past year, Nikola Corporation’s stock value has fallen by 31.9%, indicating a bearish momentum and potential further price declines.
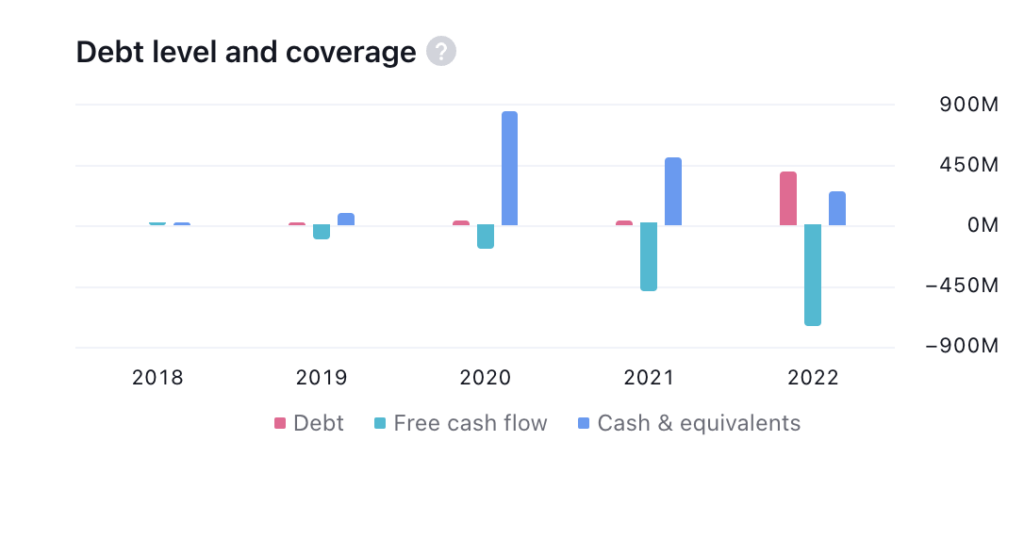
Nikola Corporation has a debt of $383 Million and cash and equivalents of $44 Million. The stock’s free cash flow is negative at around $344 Million. Furthermore, the stock has a negative ROI of 5.7%. These financial indicators suggest a challenging situation for the company’s financial sustainability. This might cause a further decline in the price.
Nikola Corp. (NKLA) Stock Price Analysis
The current stock price of Nikola Corp. is positioned below both the 50-day and 100-day EMA levels. This alignment indicates a bearish trend for NKLA stock and raises the possibility of further price declines in the near future.
Additionally, an examination of the MACD indicator for NKLA stock reveals that the MACD line resides beneath the signal line, accompanied by the presence of a red histogram. These combined elements convey a bearish sentiment for NKLA stock, hinting at potential price decreases in the days ahead.
Furthermore, the trading volume for the stock stands at 429 million, and it is notable that this volume is on a decline as evident on the charts. This decrease in trading volume signifies the dominance of sellers in the market.
Conclusion
As per the analysis, it appears that NKLA stock is currently in a downtrend and the price is moving in a falling wedge pattern. Moreover, the stock has experienced a negative return of over -64% in the previous year. The overall price structure of NKLA stock is exhibiting a negative pattern, and the indicators are signaling a negative outlook. Therefore, it is likely that the price will continue to decline in the near future.
Technical Levels
- Support Level: $105
- Resistance Level: $138
Disclaimer
The views and opinions of the author, or anyone named in this article, are for informational purposes only. They do not offer financial, investment, or other advice. Investing or trading crypto assets involves the risk of financial loss.




