
 Dacity Coin
 Pearl
Pearl Bitcoin
 Injective
 Pudgy Penguins
 Quantus
 Starknet
- Exxon Mobil Corp (XOM) is an American Multinational Oil and Gas company. It is ranked 12th on the Fortune Global 500 and 3rd on the Fortune 500.
- The XOM share is listed on the New York Stock Exchange(NYSE). The Oil and Gas price will rise, which eventually leads to an increase in the earnings of the company. It will also positively affect the share price.
- Let us do some analysis on XOM with the help of technical and fundamental analysis.
Fundamental Analysis of XOM
The Market capitalization of XOM as of 2023 is $446.36 Billion. The current market price of XOM on 05 October 2023 is $111.50.
Its Total Revenue has been boosted in 2022 as compared to the previous year. The Total Revenue in 2022 was $413.68 Billion.
Overall the fundamentals of XOM in 2022 performed well in comparison with the previous year. The Operating Income increased in 2022, which was $77.753 Billion. Its Net Income increased in 2022, which was $55.740 Billion. The company was formed from the split of Standard Oil as per the U.S. Supreme Court order in 1911. It merged with Mobil in 1999 to form its current name.
Technical Analysis of XOM
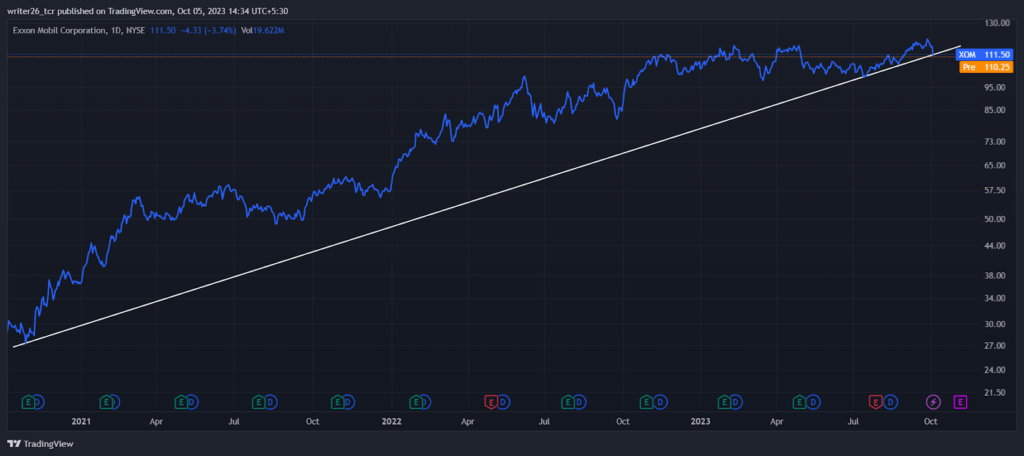
Since 2021, the stock has been performing well. It is in bullish momentum because it is continuously in an uptrend position. Overall the stock is up by 2,303%, which indicates that the stock might have given good returns to its investors in the past. It is possible as XOM has strong fundamentals and technical analysis. Near the current market price, it might take another support from the trend line and might continue its upward momentum.
Their earnings will increase as the price per barrel increased from $69.23 on 23 June to around $90 currently. Its ATH (All-Time High) was made on 18 September 2023, which was around $120. The price may increase by 0.70% by 10 October 2023. It might reach a $112.28 price level. Greed and Fear show 39(Fear). The price changing rate was around 3.23% over the last 30 days. The stock recorded 15/30 green days in the last 39 days. In the next 7 days, it might rise by 0.98%.
Live Chart of XOM
Conclusion
As per the analysis, we can say that the stock is performing extremely well. It is suitable for the short-term duration because of its uptrend momentum. The analysis is done to provide technical information about the stock. It might carry its bullish momentum in the future. In the 5-D time frame, it was down by 6.94%, and last month it was down by 1.79%. Last year, it was up by 12.49%. In 6 months, it was down by 4.69%.
Technical Levels
Support level- $101.48
Resistance level- $116.36
Disclaimer
This is a general article that does not provide any financial information. Investors should focus on both technical analysis as well as fundamental analysis. The analysis is done to provide information to readers. To make them aware of investments.




