
 Dacity Coin
 Quantus
 Pudgy Penguins
 Hyperliquid
 Injective
 NEAR Protocol
 Pearl
Pearl
- JD.Com stock price surged 3.35% in the last trading session.
- JD.Com stock price gave a breakdown from the inverted flag and pole pattern.
- The stock price fell amidst the selling pressure in Chinese stocks.
The current market price of the JD.Com stock is $29.61.
JD stock price surged by 3.35% in the previous trading session with a rise of $0.96 at the time of writing. The stock price has formed a double-bottom pattern at $28.02. JD.Com stock’s price has been continuously falling because the Chinese stocks have witnessed a huge sell-off over the concern of the country’s property sector.
The JD stock price started a downtrend in 2021, and since then, the price has witnessed a lot of selling pressure. The stock price has followed a lower high and lower low pattern which is a bearish pattern. JD stock’s price is trading near the mark it touched in 2020. This indicates that it has been a real hassle for its investors.
JD share price gave a strong breakdown from the inverted flag and pole pattern. This caused a great decline in the stock price. It declined by over 41% in a year. The company’s net profit has surged by over 41% (YoY) in the previous quarter. The JD company has maintained its net debt, as it has a net cash surplus of $23.18 Billion.
What Can Be Extracted from the JD Chart?
The stock has given a breakdown from the flag and pole pattern. The stock price has shown a massive decline from the upper band of the pattern, JD stock is currently consolidating in a range of $28 – $29.7 after the steep downfall. This can be a base formation for another rally towards either side i.e. up or down.
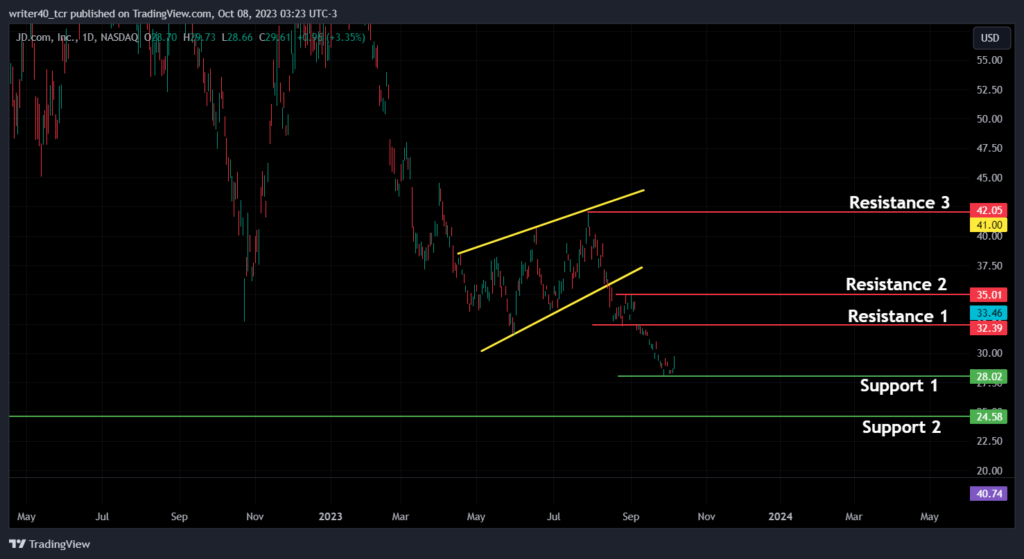
JD’s share price has taken strong support from the level of $28, and it will further halt the price from falling. The other support for the stock price is present at the level of $24.58. If the resistance is considered, then the 1st major resistance is present at the $32.39 level. Other resistances are present at $35.01 and $42.05, they are marked in red on the chart.
Bollinger Band
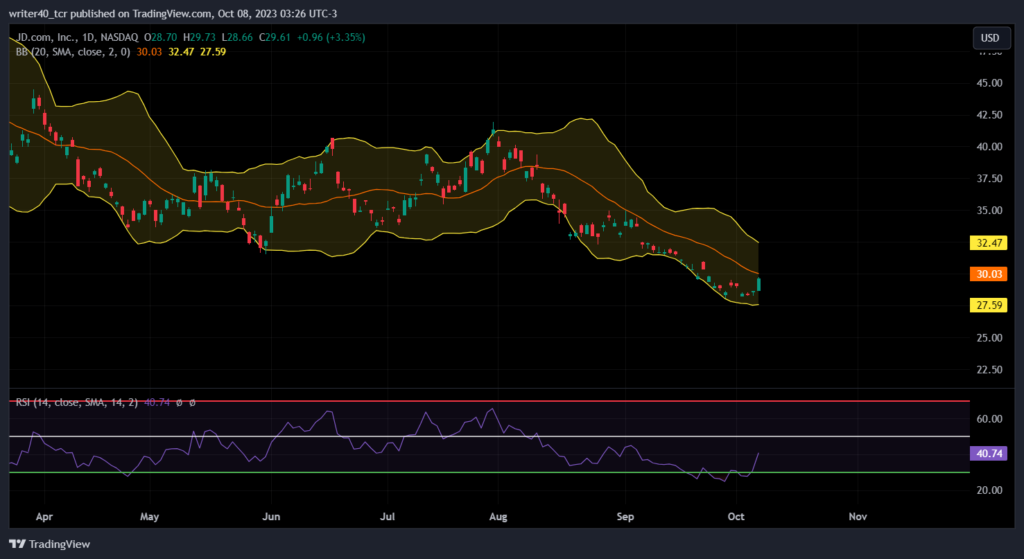
JD stock price has been rising from the lower band of the indicator and currently inching closer to the median line. The slope of the Bollinger Band is down which can create some trouble for the price to move up. The stock price can face rejection near the level of $32.47 i.e. the upper band of the indicator.
Relative Strength Index (RSI)
The Relative Strength Index is currently placed at 40.74. The slope of the RSI is upwards which shows that the price has gained some momentum. RSI has shown a divergence from the price.
Conclusion
JD stock price has witnessed a huge downfall in the past. The stock price has shown some strength, as it formed a double-bottom pattern. If the price continues the rise from here, then it can head towards the $32.39 level. If the price breaks the support level of $28.02, then it can achieve the target of $24.58 level.
Technical Levels
- Resistance Levels: $32.39 and $35
- Support Levels: $28.02 and $24.58
Disclaimer
The views and opinions stated by the author, or any people named in this article, are for informational purposes only. They do not establish financial, investment, or other advice. Investing in or trading crypto assets comes with a risk of financial loss.




