
 Dacity Coin
 Injective
 NEAR Protocol
 Quantus
 Bitcoin
 Pearl
Pearl Sui
Sui
- Stacks (STX) is an open-source platform to enable DeFi, NFTs, and Smart contracts for BTC. It was started by Muneeb Ali and Ryan Shea.
- This platform raised $75 Million through sales of tokens and a mix of venture capital. It was launched in January 2021.
- Let us analyze the STX coin through technical analysis and collect some information about the coin.
The market capitalization of STX is $724,896,962. Its market cap decreased by 0.95%. The volume in 24 hours has decreased by 40.11% and the percentage is fluctuating. Its trading volume in the last 24 hours is $16,036,998. Going by market capitalization, it is ranked 47th out of the total 8,981 active cryptocurrencies. The liquidity percentage of the STX token is 2.28%. Its total market supply is 1,818,000,000 STX. The current circulating market supply is 1,412,460,276 STX, which is 77.69% of the total supply.
Technical Analysis of STX
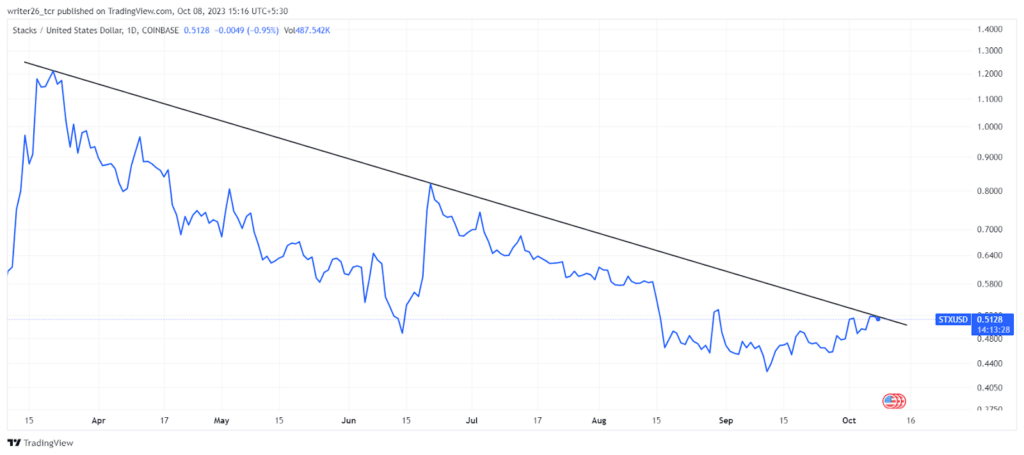
The chart indicates to us that the coin is moving in a downward direction. Since April 2023, the coin has not performed well in the 1-D time frame. In today’s session, it is down by 0.80%. Its ATH (All-Time High) was made on 20 January 2022, which was around $2.48.
As of the latest data, the Fear & Greed Index (F&I Index) for the STX token stands at 50, categorizing the current market sentiment as “Neutral.” It indicates that there is a cautious or bearish sentiment prevailing among STX investors and traders. Additionally, over the past 30 days, STX has experienced 15 out of 30 days with positive price movements. This indicates a somewhat bullish trend during this period. The price is changing at a rate of 4.08% over the last 30 days. Since April 2023, the coin has been moving in a downward direction. It is in bearish momentum because it is continuously in a downtrend position.
SMA and EMA (50,100,200)
SMA 50- $$ 0.476631 (Buy) and EMA 50- $ 0.495830 (Buy)
The SMA 100- $$ 0.546853 (Sell) and EMA 100- $ 0.531404 (Sell)
The SMA 200- $ 0.639299 (Sell) and EMA 200- $ 0.563090 (Sell)
Live Chart of STX
Conclusion
As per the analysis, we can say that the STX coin is not performing well in the daily time. It is not suitable for the short-term duration because of its downtrend momentum. The analysis is done to provide technical information about the stock. It might carry its bullish momentum in the future. In the 7-D time frame, it was up by 1.31%. Last month, it was up by 11.26%. Last year, the STX coin was up by 55.26%. It might continue to fall in the future.
Technical Levels
Support level- $0.4555
Resistance level- $0.6377
Disclaimer
This is a general article that does not provide any financial information. Investors should focus on both technical analysis as well as fundamental analysis. The analysis is done to provide information to readers. To make them aware of investments.




