
 Quack AI
 NEAR Protocol
 Pearl
Pearl Zcash
Zcash Quant
Quant Pudgy Penguins
 Quantus
- The FRAS share price is currently trading at 823 GBX.
- The price is trying to give the breakout of the current major resistance.
Frasers Group Plc (LSE: FRAS) is a sporting goods retail company, which deals in the sales of sports, premium, and luxury brands. The company was founded in 1982 by Michael James Wallace Ashley.
Frasers Group Plc (FRAS) Stock Analysis
823 GBX is the current trading value of the FRAS share, which has gained 2.17% in the last trading session. It has a market capitalization of 3.456 billion USD and trades with a 10-day average volume of 507.981K.
1-Day Chart Analysis of FRAS Stock
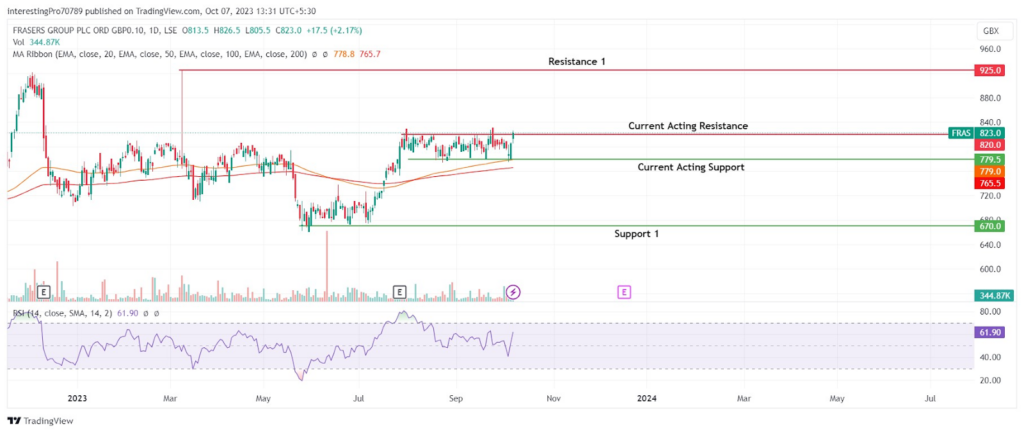
In the last two trading sessions, FRAS’s share price has gained almost 5.50%. The price can be seen trading in a range of 820 GBX to 779.5 GBX. It seems that the price is trying to give the breakout of the 820 GBX resistance. It has tried to give the breakout of the 820 GBX previously but couldn’t close above it.
The 100-day and 200-day EMA lines are below the FRAS share price. Recently, a strong bullish candle has been formed by taking support from the 100 EMA line. It shows the bulls are dominating in the current scenario and have control over the price.
The relative strength index is at 61.90, which is marked in bullish territory. The RSI line is sloping in the upward direction, indicating more room for buyers in the upward direction to make the price rise.
Currently, the buyers are in control of the price and they are to make the price close above the 820 GBX resistance level. If the price sustains above 820 GBX after giving the breakout. It may rise to its next resistance at 925 GBX. However, for the FRAS stock price to be in bearish sentiment, it must give the breakdown of the 779.5 GBX support and should sustain below it. Then only it may rise to its next support level at 670 GBX
Conclusion
The FRAS Stock price is currently bullish as the price has gained 5.50% in the last two trading days by forming strong bullish candles. The price is currently trying to give the breakout of the 820 GBX. The technical indicators mentioned above for the analysis of FRAS price are bullish at the time of writing.
If it closes above the 820 GBX and sustains above it then it may rise to its next resistance at 925 GBX. However, for the price to give a bearish move it must close below the 779.5 GBX support level after which it may fall to its next support at 670 GBX.
Technical levels
Resistance Levels: 820 GBX and 925 GBX.
Support Levels: 779.5 GBX and 670 GBX.
Disclaimer
The views and opinions stated by the author or any other person named in this article are for informational purposes only. They do not provide financial, investment, or other advice. Investing or trading comes with a risk of financial loss.




