
 Quack AI
 Pudgy Penguins
 Injective
 Solana
 NEAR Protocol
 Canton
 Zcash
Zcash
- The JNJ share price is currently trading at $157.64.
- The price is currently retesting its broken level of $157.69 after the breakdown of this level.
Johnson & Johnson (NYSE: JNJ) is a pharmaceutical and medical technologies company. It works on the manufacture and sale of products in the healthcare field.
Johnson $ Johnson’s (JNJ) Stock Analysis
After gaining 0.32% in the last trading session with a trading volume of 5.802 million the JNJ price is trading at $157.64. The market capitalization of Johnson and Johnson is around 379.599 billion USD.
Is JNJ’s 1-Day Chart Showing Bear Market to Continue?
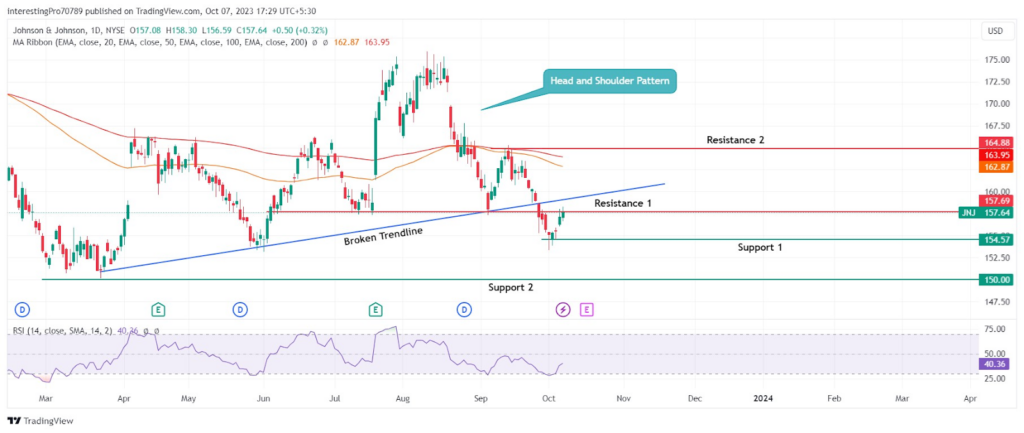
Recently, JNJ stock’s price after giving the breakdown of the trendline and also the head and shoulder pattern neckline at $157.69. It formed a support at $154.57. After forming support, it is currently retesting the $154.57 level.
100 and 200 EMA lines are trading above the price and have started to trend in the downward direction, indicating the bear’s control over the price. However, the price is a little bit far from the EMA lines. This indicates it could move up to retest the 100 EMA line or the trendline just above it
The relative strength index is below 50 which is marked as a bearish territory. However, the RSI line is trending in the upward direction showing the price could rise more. The RSI line can rise to 50 RSI level and can face resistance from there.
The overview of the JNJ chart shows that it is under the bear’s control. However, the price is in the recovery phase and could rise to retest the broken trendline.
Currently, the price is retesting the $157.69 level, and if it forms a bearish reversal candle below this level in the upcoming trading session. Then it may fall to its immediate support at $154.57.
If it gives the breakdown at the $154.57 level then it may fall to its next support is at $150.00. However, for the price to be in bullish sentiment it must reclaim the $157.69 level and should sustain above this level. After which it could rise to its resistance at $164.88.
Conclusion
The overall trend of the JNJ price is bearish. The price has recently given the breakdown of $157.69 support which is also the neckline of the head and shoulder pattern. Currently, it is trading retesting the $157.69 level and is below this level. The price may fall to its immediate support at $154.57 if it forms a strong bearish candle in the upcoming trading session.
If it also breaks below the $154.57 level then the continuation of the downtrend will continue to its next support at $150.00. However, for the price to be in bullish sentiment it must reclaim and sustain above it. Then it may rise to its next resistance at $164.88.
Technical levels
Resistance Levels: $157.69 and $164.88.
Support Levels: $154.57 and $150.00.
Disclaimer
The views and opinions stated by the author or any other person named in this article are for informational purposes only. They do not provide financial, investment, or other advice. Investing or trading comes with a risk of financial loss.




