
 Minter
 Bittensor
 Hyperliquid
 NEAR Protocol
 Monero
 Pearl
Pearl Quantus
- In its last intraday session, the AZN share price experienced a decline of $0.56%.
- AstraZeneca’s financial report shows its consistent growth annually.
AstraZeneca (NASDAQ: AZN) is a global pharmaceutical and biotechnology company. It specializes in researching, developing, and manufacturing prescription medicines.
AstraZeneca (AZN) Financial Report Analysis
AstraZeneca has shown quality growth in its 2022 financial report. This firm has experienced increased revenue, gross profit, and exceptional growth in its net income. It has also managed to keep its debt-to-equity ratio under 1.0, which is a good ratio for companies. It shows that the company has no major debts that are due.
AstraZeneca has maintained its financial growth in its 2023 annual report, where its finances have grown steadily. In 2023, again the company has managed to keep its debt ratio under 1.0, which shows it is majorly running on its own funds.
The previous and current running financial status of the company shows that it is in very good shape.
AstraZeneca (AZN) Stock Price Analysis
The AZN’s share price has faced a decline of 0.65% in its last intraday session and is currently trading at $67.04. The company has a market capitalization stands at 207.545 billion USD. Its stock trades with an average 10-day trading volume of 3.663 million.
Is AZN 1-Day Chart Showing Signs of Incoming Selling?
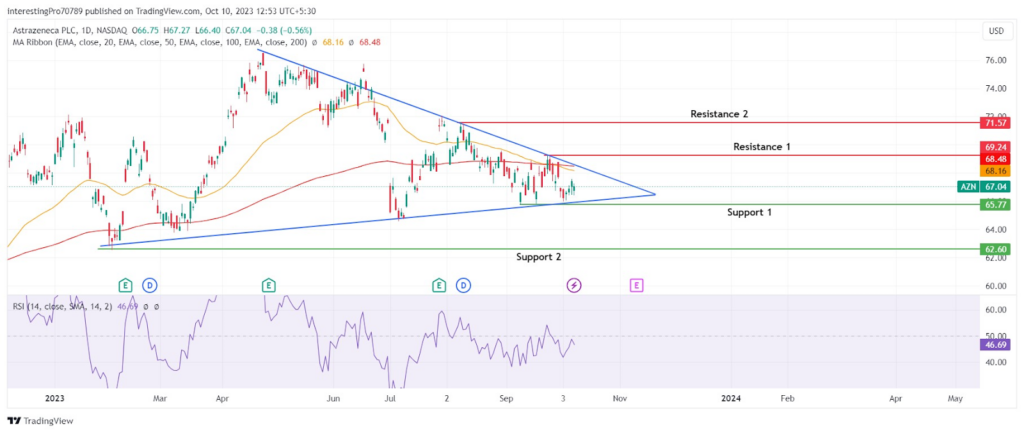
Currently, AZN’s share price is trading inside a symmetrical triangle pattern. In the last five trading sessions, the share price has increased by 1.25% after taking support from the $65.77 level.
The 50 (yellow) and 200 (RED) EMA lines have recently shown a crossover between them. The 50 EMA intersected the 200 EMA from upside to downside. It shows the price is getting more influence from sellers, which has made the EMA lines do a bearish crossover.
The RSI line has just faced resistance from its 50 level and has started to decline in the downward direction. It shows the AZN price has more influence on sellers compared to buyers in the current scenario. It also indicates more room for sellers on the downside to make the price fall.
The technical indicators point towards the bear market in the AZN 1-day chart. Yet, it would be better to wait for the confirmation, which would be the breakdown of the $65.77 support. If the price breaks below the $65.77 support, it may fall to its next support at $62.60.
However, the price sustaining above the $65.77 support can make it rise and could retest the EMA lines and $69.24 resistance. If the price gives the breakout of the $69.24 level, it may rise to its next resistance at $71.57.
Conclusion
The Current scenario and technical indicators of AZN stock show that it is under the sellers’ influence. However, it would be better to wait for the price to give the breakdown of the $65.77 support after which it may fall to its next support at $62.60.
As long as the price is sustained above $65.77 support, it may retest the EMA lines and $69.24 resistance. If it gives the breakout of $69.24 resistance, it may rise to its next resistance at $71.57.
Technical levels
Resistance Levels: $69.74 and $71.57.
Support Levels: $65.77 and $62.60.
Disclaimer
The views and opinions stated by the author or any other person named in this article are for informational purposes only. They do not provide financial, investment, or other advice. Investing or trading comes with a risk of financial loss.




