
 Boomer
 hi
hi Claudia
 Covenant x402
 Pearl
Pearl Quantus
 Bitcoin
- Tech companies including ROKU Inc. have laid off more than 239K employees globally.
- In just the last two weeks the price has seen a decline of more than 20%.
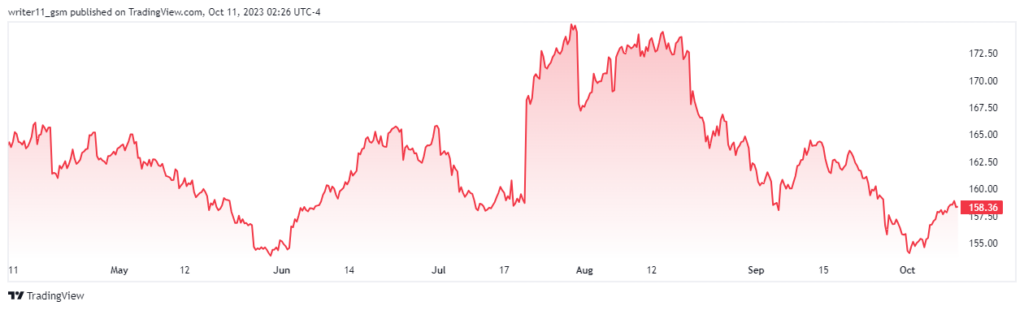
Roku Inc. was founded nearly 21 years ago and is an American company that manufactures digital media players for video streaming. The company also operates an ad-supported video-on-demand service. The company has its headquarters in San Jose California, and has an advertising business too. It also has licenses for its hardware and software to other companies.
ROKU stock follows a PE ratio of -15.82 which indicates that the investors in the market are willing to pay 15 times less of the earnings per share of the company. It also has an EPS of -4.72 USD indicating the earnings of the company on each share. Roku Inc. has 123.313M shares floating in the market available for trading.
Roku Inc. does not pay any dividends which indicates that it reinvests all of its profit for further growth of the company. The stock has a gross margin ratio of 41.47%. The average trading volume of the ROKU share is 8.24M recorded in the last three months.
Roku Inc. Stock Performance Analysis
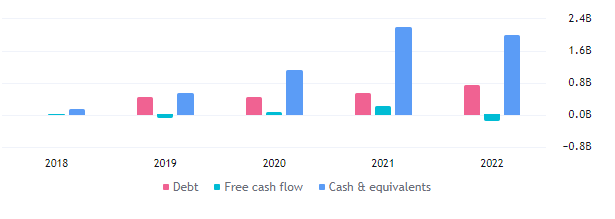
The financial charts of Roku Inc. clearly show that the revenue of the company has been consistently advancing throughout the years. This advance in revenue is also followed up with an advance in debt which is a negative factor for the company. Currently, the company has a debt of $719.33M in the year ending 2022.
Performance Analysis of ROKU Stock

Roku Inc. has met the experts’ expectations over the years in revenue. This indicates that the company has the potential to meet the required financial growth in the future. The experts are neutral on the stock but the technical indicators are indicating a bullish sign on the daily timeframe.
Will Roku Stock Below The Channel Pattern or Lead To Higher Swings?
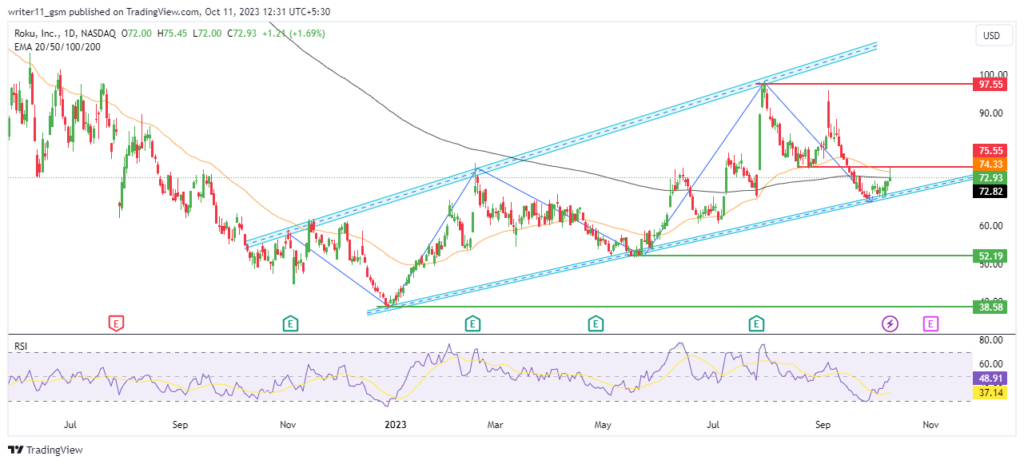
The ROKU stock price revolves inside an expanding wedge pattern. The most recent price behavior of the stock indicates a huge sell-off in the stock from higher levels. This could lead to a dominance of sellers and we might get to see a breakdown in the stock price below the pattern.
The EMAs on the ROKU stock chart are following a golden cross. The share price has declined below the 50-day and the 200-day EMA. The EMA have also contracted and are trading very close to each other. The following behavior of the EMAs indicates the signs of change in trend in the upcoming days.
The RSI for the ROKU share is giving sell indications as it is trading below the 50 level advancing from the oversold zones. Advancing in level might seem bullish but if the RSI has declined to oversold zones and is trading at 48.91, it indicates a bearish wave in the stock.
Conclusion
The ROKU stock is trading in a downtrend inside the wedge pattern making lower lows. The technicals for the stock are also negative indicating a sell signal and probable change of trend to bearish. The company has reliable financials but the debt has been consistently rising over time.
Therefore, considering the fundamentals and technicals we can expect a breakdown in the share price which can lead the ROKU stock price to further lower levels.
Technical Levels
- Support levels- $38.50 and $52.00
- Resistance levels- $75.50 and $97.50
Disclaimer
The information provided in this article, including the views and opinions expressed by the author or any individuals mentioned, is intended for informational purposes only. It is important to note that the article does not provide financial or investment advice. Investing or trading in cryptocurrency assets carries inherent risks and can result in financial loss.




